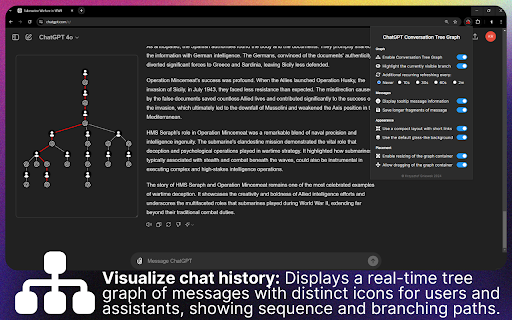



ChatGPT Conversation Tree Extension ai chrome extension? This extension enhances your ChatGPT experience by providing a dynamic conversation tree graph inside a container that you can resize and move around the ChatGPT website. The graph visually represents the flow of your conversation, showing the sequence of messages and their branching paths. Informative tooltips display message content, version, and sibling count when you hover over nodes in the graph, making it more comprehensible to understand the branching history of the conversation. Additionally, you can zoom and drag the graph itself within the container, allowing for detailed exploration of the conversation structure. This feature is particularly valuable for getting oriented in even the most complexly branched conversations. This extension efficiently checks for new messages and updates the tree and highlights currently visible branch accordingly, without wasting resources when not in use.
A ChatGPT extension visualizing conversation flow with a dynamic, interactive tree graph.
- Tracking complex ChatGPT conversations with multiple branches
- Understanding the history and context of a long conversation
- Navigating back to specific points in a conversation
- Install the extension. A graph container appears on the ChatGPT website. Use the settings popup to customize the graph's appearance and behavior. Interact with ChatGPT as usual; the graph updates automatically. Use the buttons in the top-left of ChatGPT to toggle visibility and manually update the graph.

Opennote is a deep research and open notes platform for students with AI-powered tools.


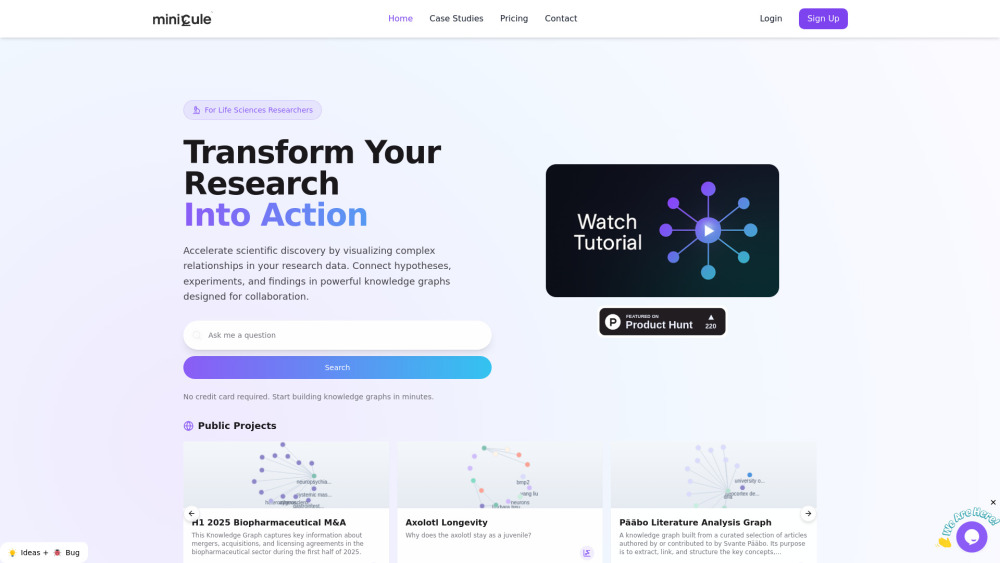
AI-powered research web app for building scientific knowledge graphs.

Data + Context for AI and Apps

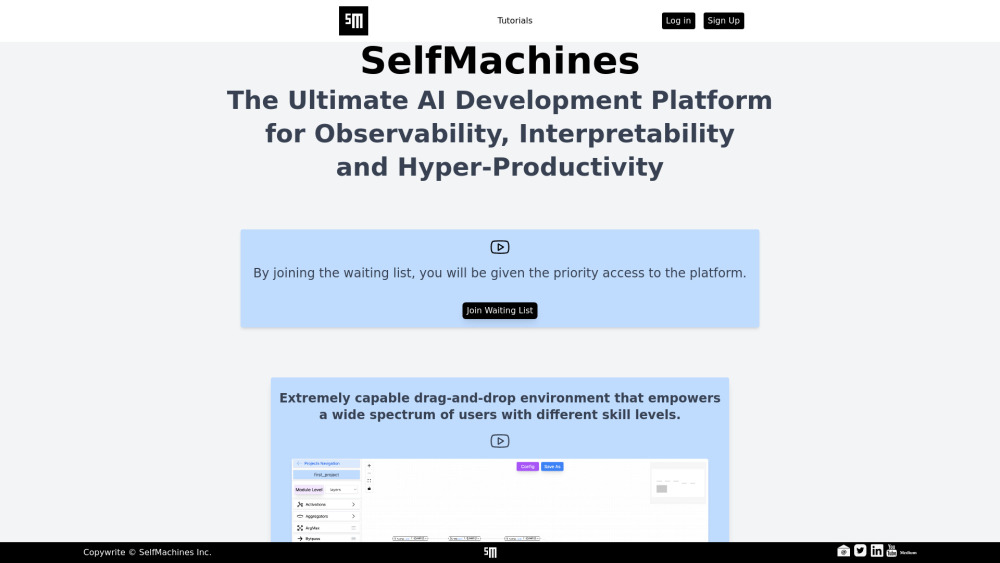
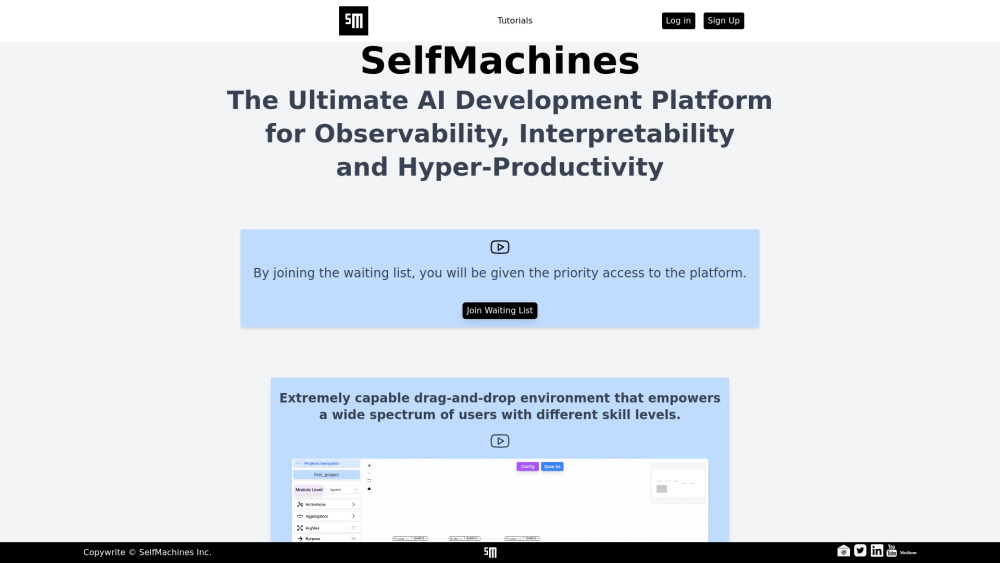
No-code platform for building and deploying graph-based ML agents and AI systems.

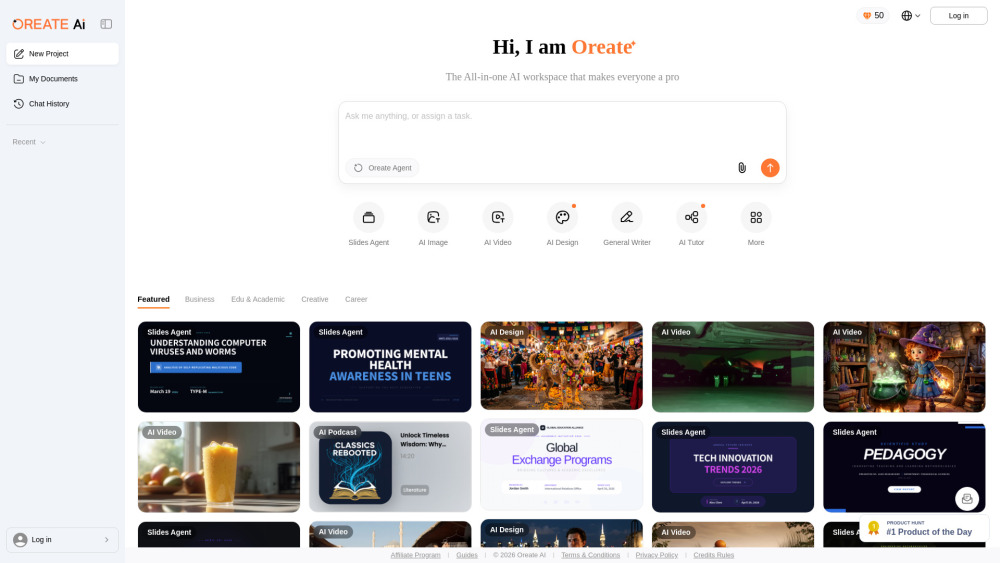
All-in-one AI Workspace: Create professional slides, essays, videos, images, podcasts, and deep research in minutes.

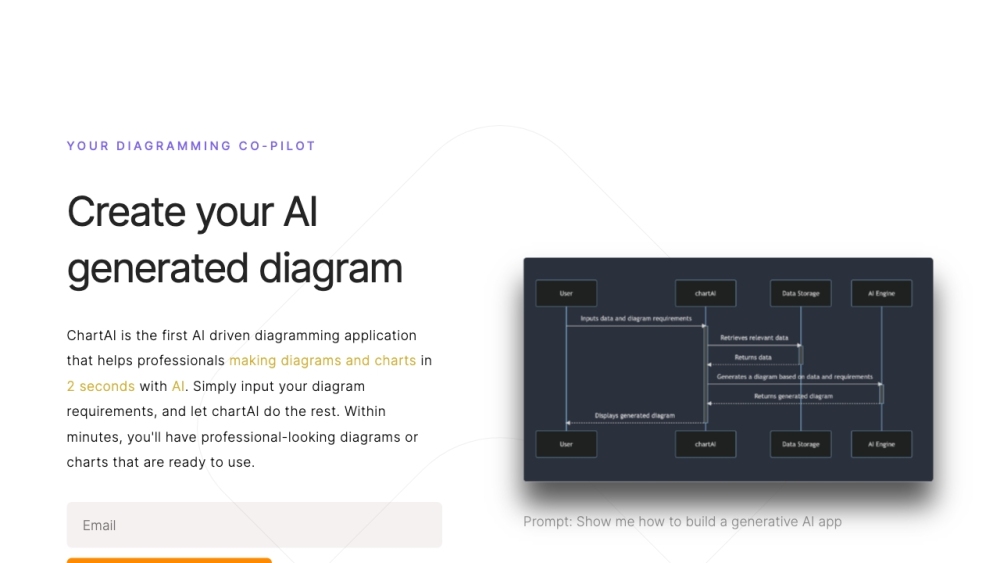
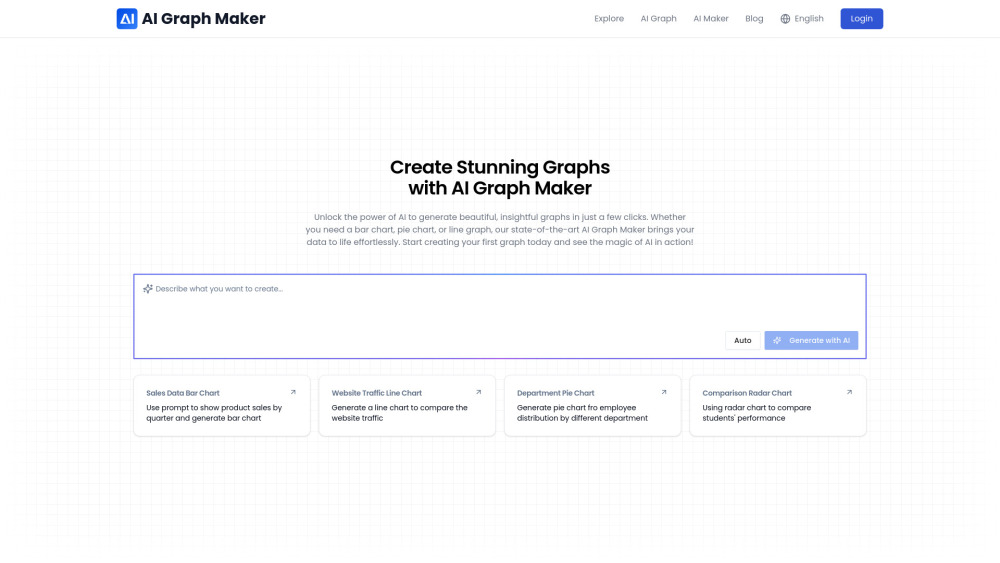
AI-powered diagram and chart creation tool that generates professional visuals in seconds.

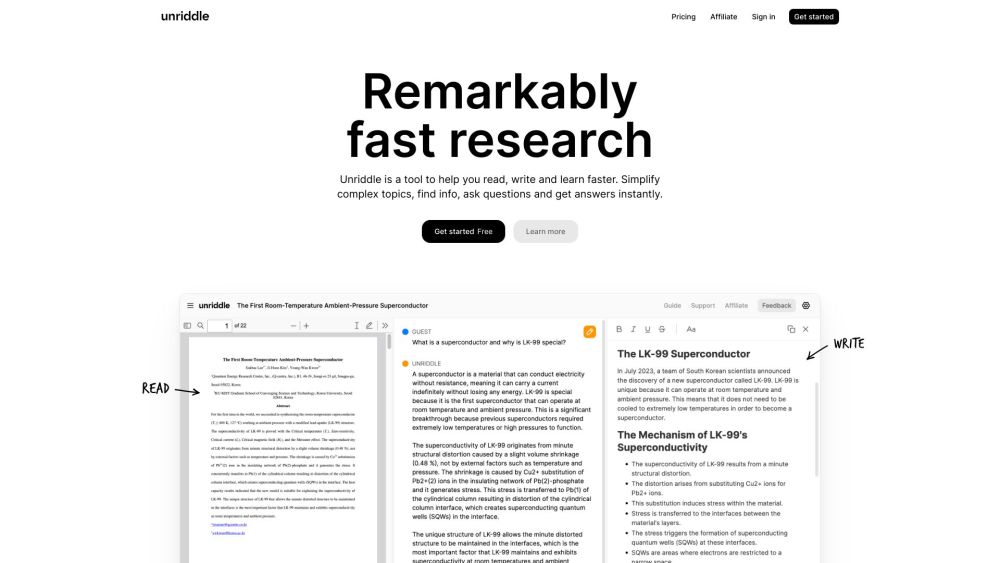
An AI research assistant to understand, organize, and write scientific documents faster.

Graphy simplifies data storytelling with easy, fast, and beautiful graph creation for everyone.


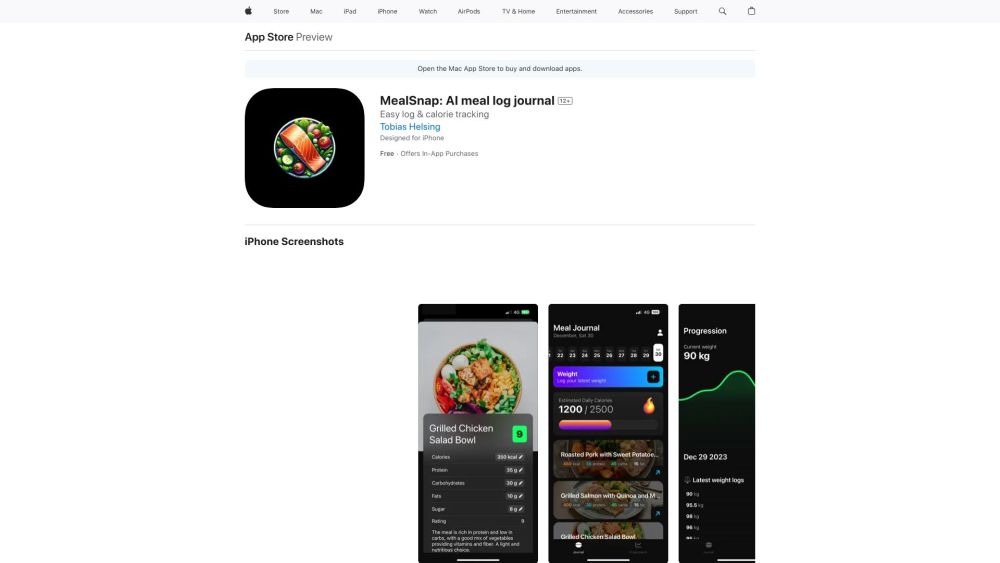
AI-powered meal logging and calorie tracking iPhone app.

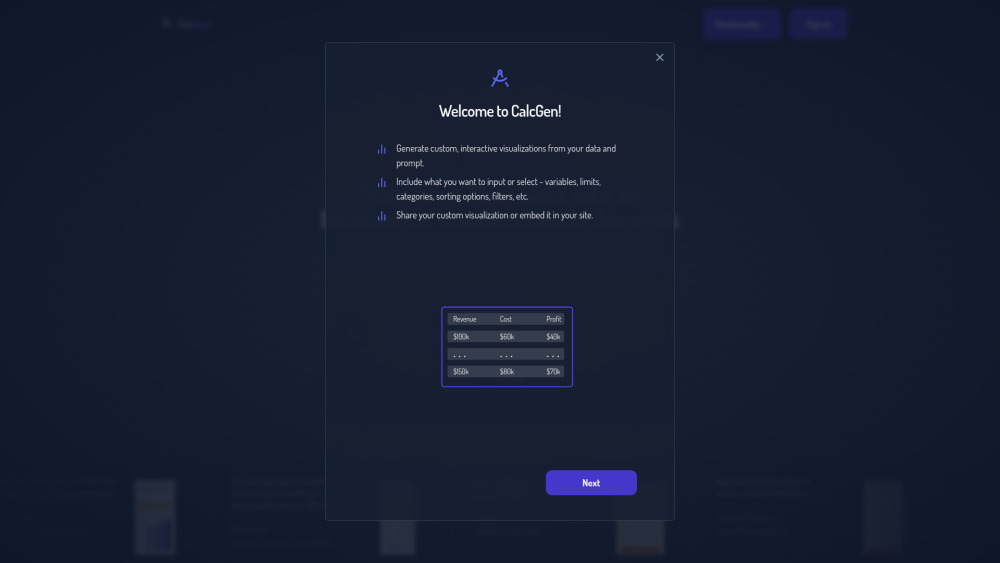
AI-powered platform for creating interactive charts, graphs, calculators, and data visualizations.

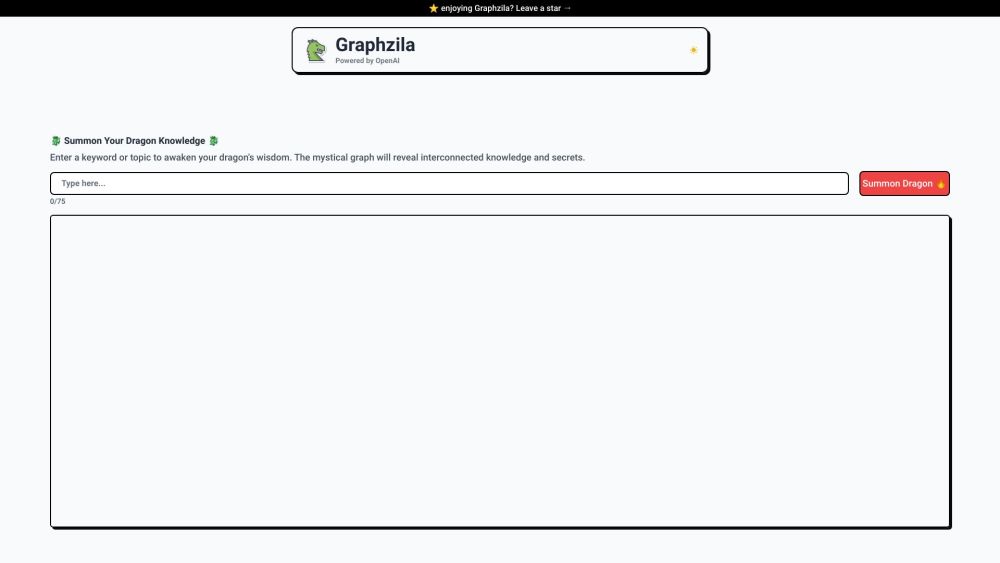
Graphzila creates knowledge graphs from text using OpenAI's GPT-3.5 Turbo.

Web-based platform for software development and version control using Git.
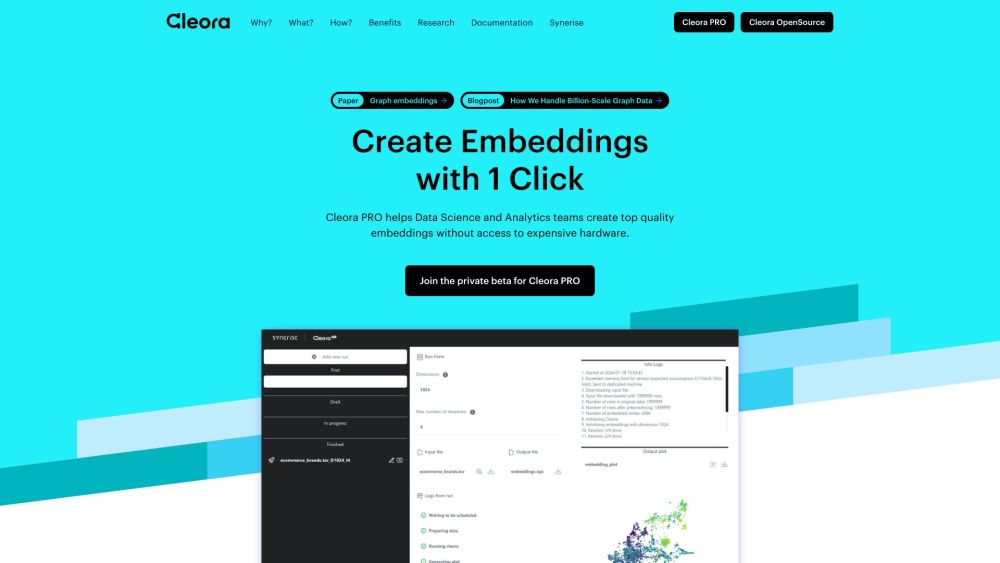

AI-powered tool to create stunning data visualizations effortlessly and quickly.

STEP 1 is an AI-based Web3 user graph for reward optimization using big data.


AI analytics tool that answers questions about your business data in plain English. Instead of manually digging through spreadsheets and reports to understand why numbers changed, ask Scoop "why did sales drop?" or "which customers are likely to leave?" and it investigates automatically. Connects to your business tools (Salesforce, databases, spreadsheets) and explains what it finds in normal language. For teams who need quick answers without technical skills.


Your own AI powered with video understanding, web search and much more


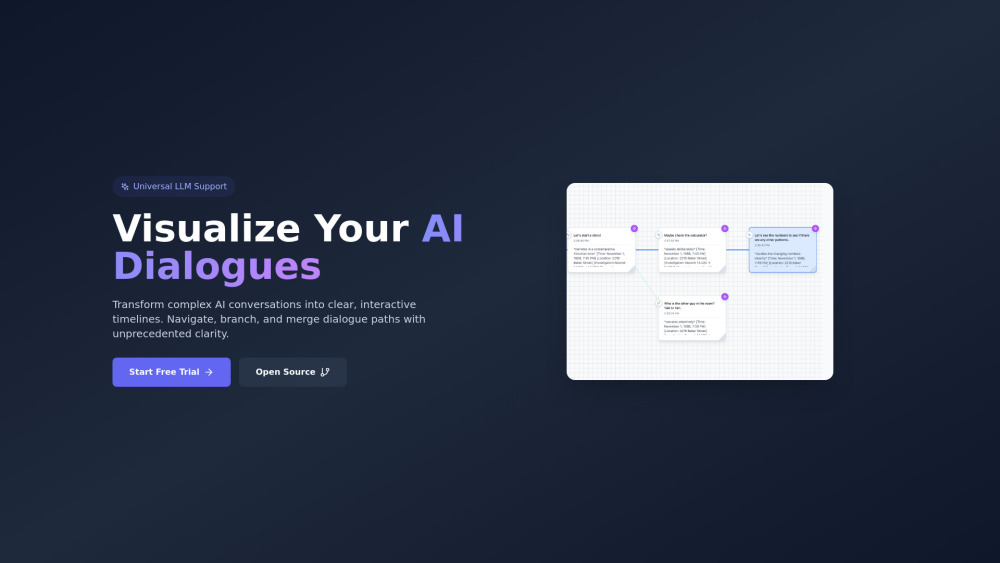
Visualize and manage AI conversation flows with interactive timelines and branching.

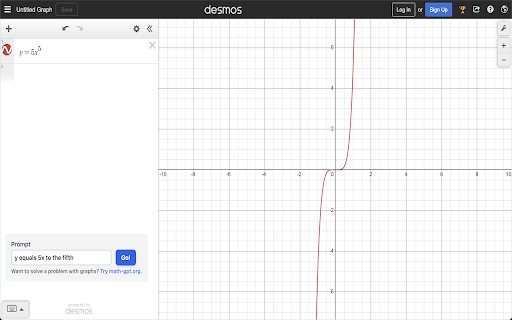
MathGPT graphs functions on Desmos and solves integrals and derivatives using AI.