Chartpixel


ChartPixel is an AI-assisted data analysis and insights visualization platform that simplifies complex data analysis, making it accessible within seconds and with zero learning curve. It provides powerful AI-driven data analysis, interactive charts & graphs, and actionable insights from various data sources like messy data or questionnaires. ChartPixel's AI capabilities are rooted in robust statistics, helping users create appropriate charts and visualizations with explained insights and key takeaways. Users can also chat with their data and charts to uncover key information through AI-driven analysis. The platform aims to demystify data and analysis, empowering users to make sense of their data without hassle, suitable for both beginners and seasoned analytics professionals.
AI-assisted data analysis and visualization platform for instant insights.
- Transforming research and business data into clear visuals and actionable insights.
- Analyzing customer satisfaction and sentiment from surveys (e.g., NPS surveys).
- Tracking trends and forecasting in financial data (e.g., stock market data).
- Empowering students and hobby analysts to understand datasets without coding.
- Assisting business owners in gathering data and insights independently for better decision-making.
- Helping editors and journalists automate data work to enhance journalistic content.
- To use ChartPixel
- first
- upload your data (Excel
- CSV
- web tables
- or via keyword search). Second
- lean back as ChartPixel automatically tidies up and enhances your data
- selecting the most insightful chart types without manual column or chart selection. Third
- get your interactive charts and more
- which are explained with written insights. You can then customize
- share online
- embed

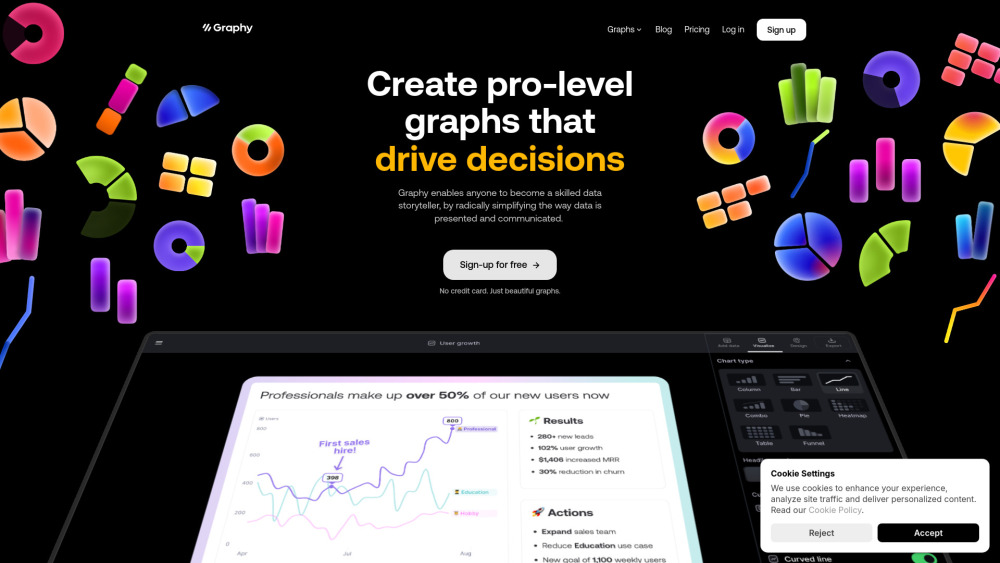
Graphy simplifies data storytelling with easy, fast, and beautiful graph creation for everyone.

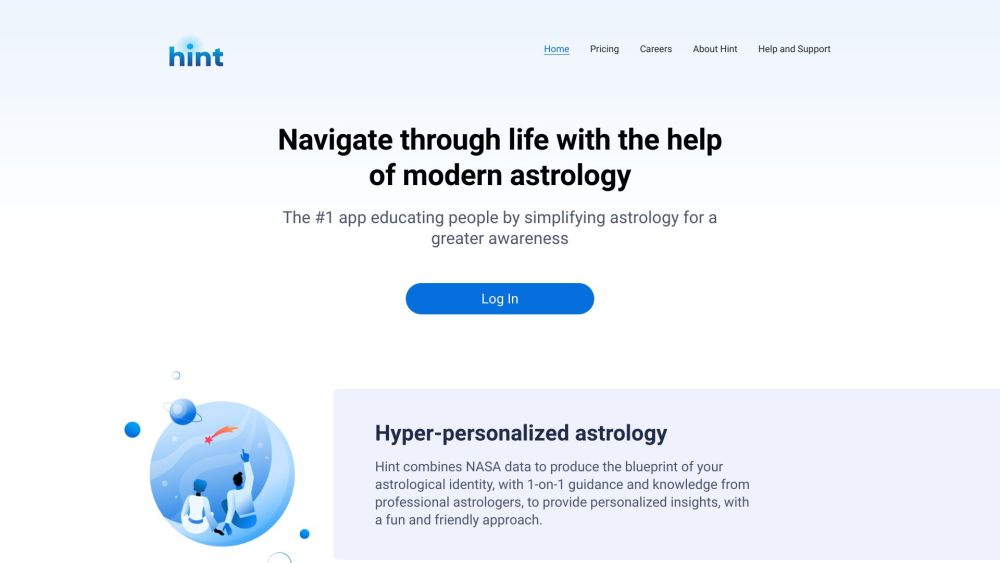
Hyper-personalized astrology & horoscope app with AI and expert astrologer guidance.

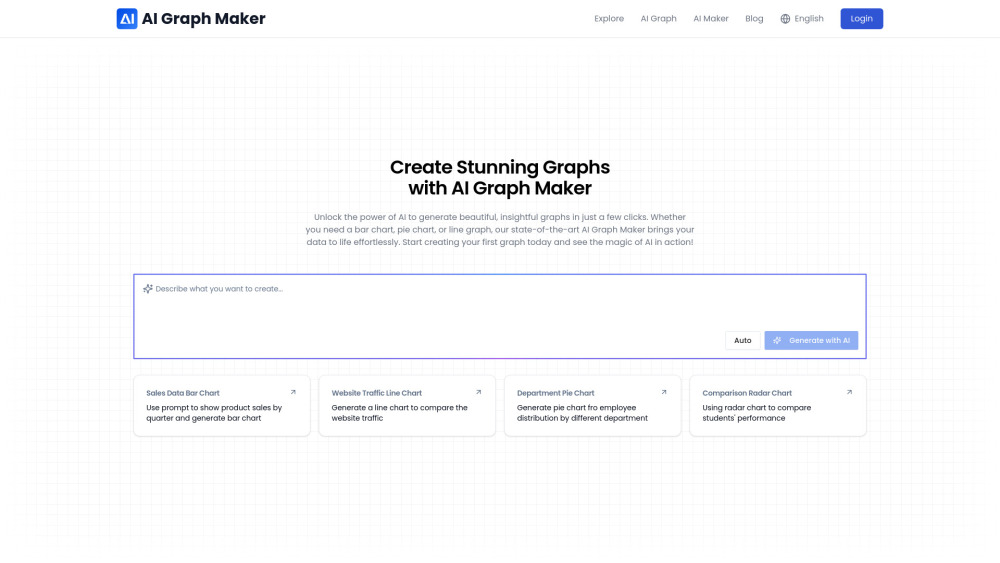
AI-powered tool to create stunning data visualizations effortlessly and quickly.

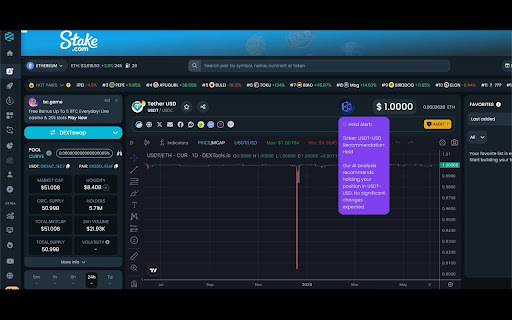
ChartIQ AI provides AI-powered insights to enhance trading decisions and outcomes.

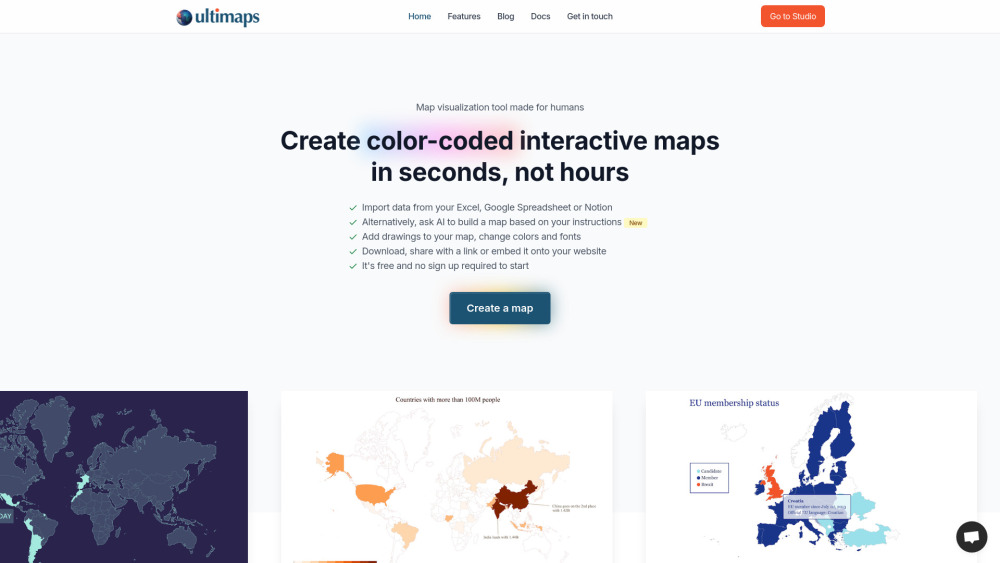
Map visualization tool for creating interactive and custom maps from data or prompts.

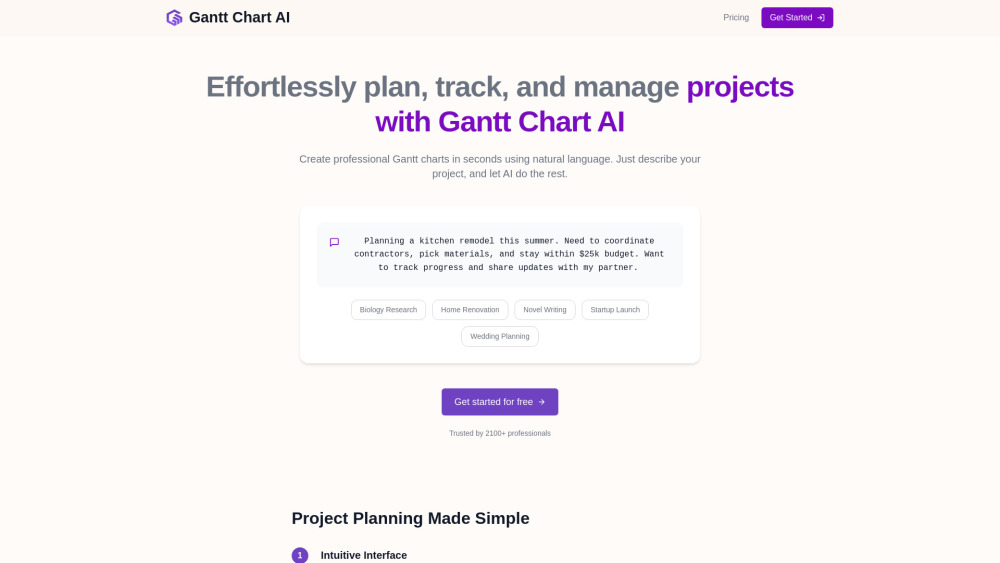
AI-powered tool for creating project timelines and Gantt charts using natural language.

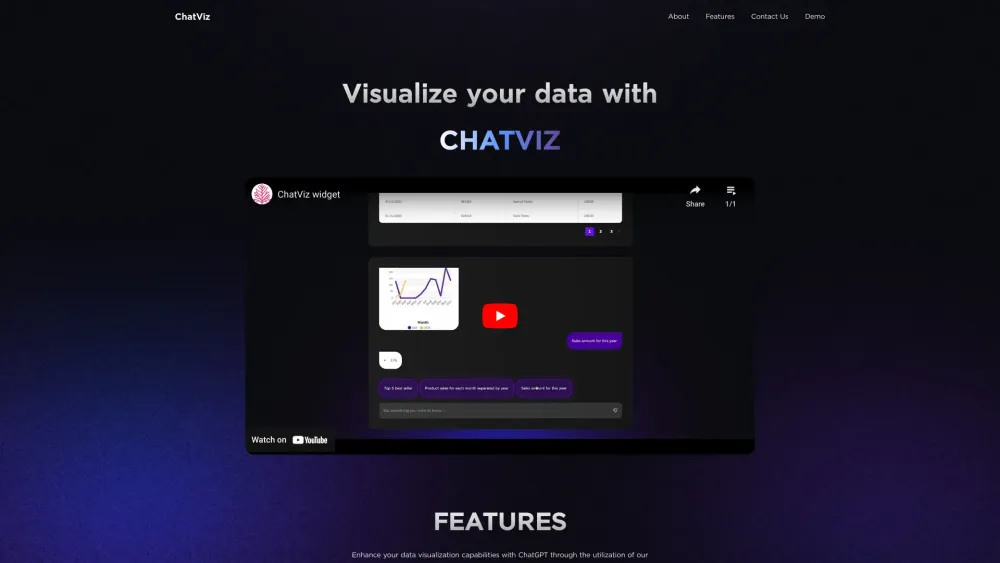
A developer tool to visualize data using ChatGPT.

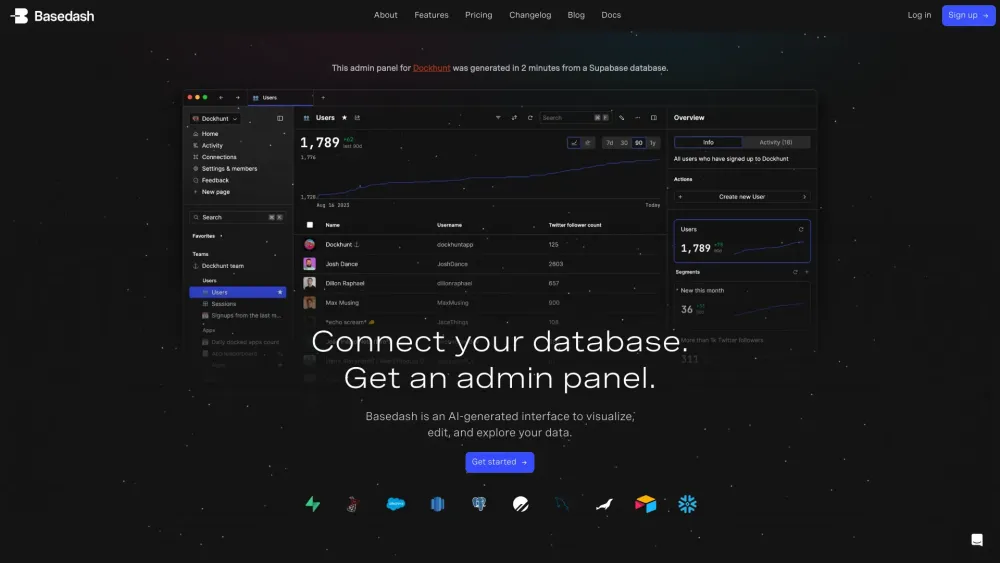
AI-powered business intelligence platform for data visualization and querying using natural language.

AI Medical Scribe for accurate, real-time clinical notes, boosting efficiency and reducing burnout.