D



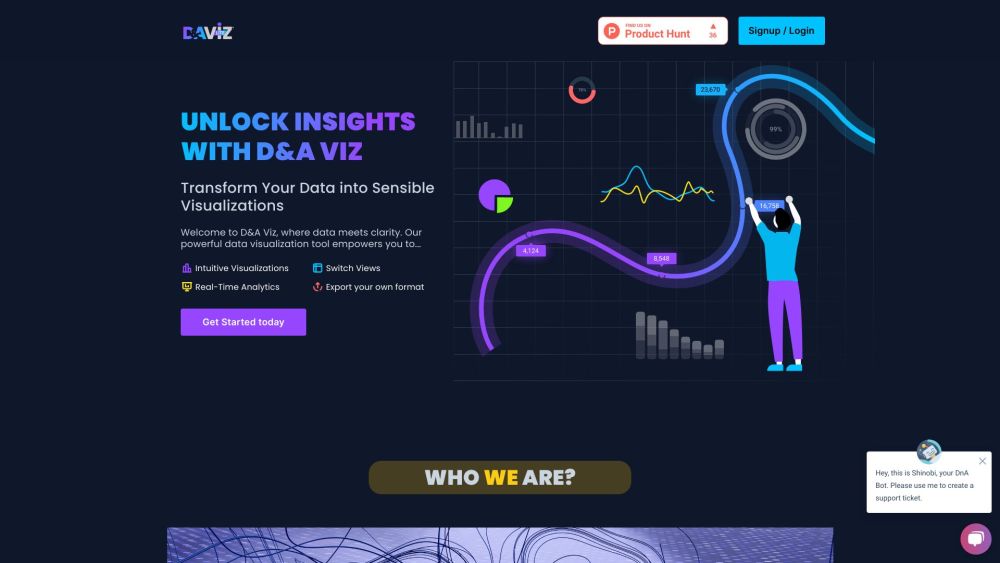
D&AViz is an AI-powered data visualization tool that transforms raw data into vibrant visuals. Users can seamlessly upload Excel/CSV files, query the tool, and witness the creation of pie, donut, or linear graphs. It decodes complex data into actionable insights for informed decision-making.
AI tool transforming raw data into visual insights for informed decisions.
- Transforming raw data into understandable charts and graphs for better decision-making.
- Upload Excel/CSV files
- query the tool
- and customize visualizations to suit your needs. Explore and share interactive dashboards effortlessly.

AI-powered research web app for building scientific knowledge graphs.

Graphzila creates knowledge graphs from text using OpenAI's GPT-3.5 Turbo.

A ChatGPT extension visualizing conversation flow with a dynamic, interactive tree graph.
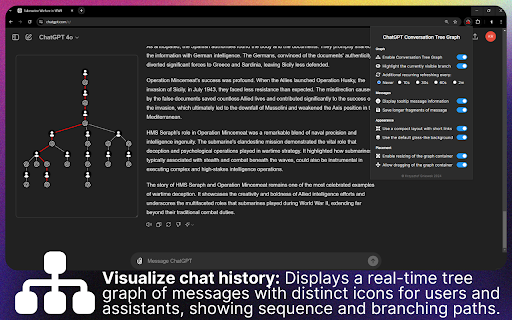

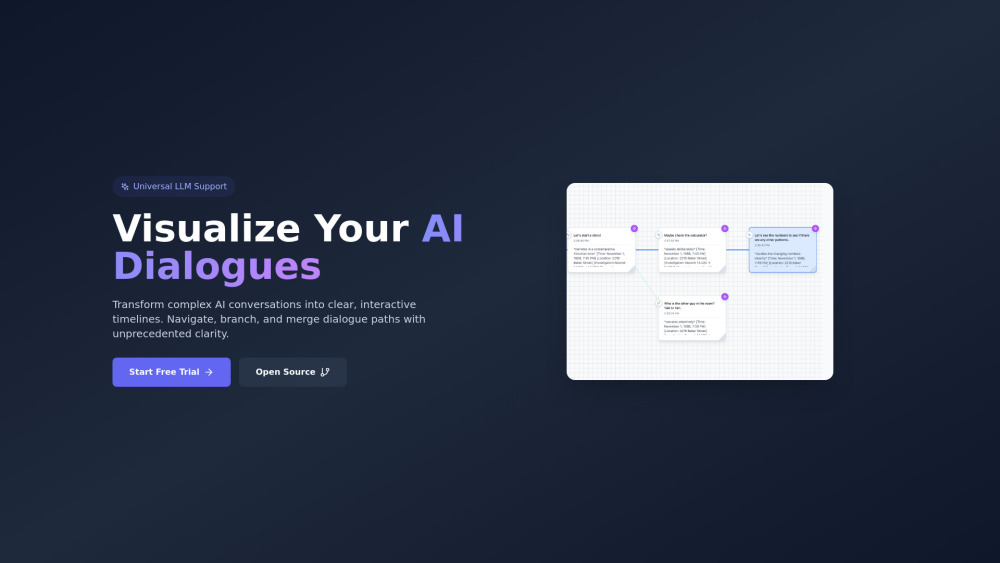
Visualize and manage AI conversation flows with interactive timelines and branching.

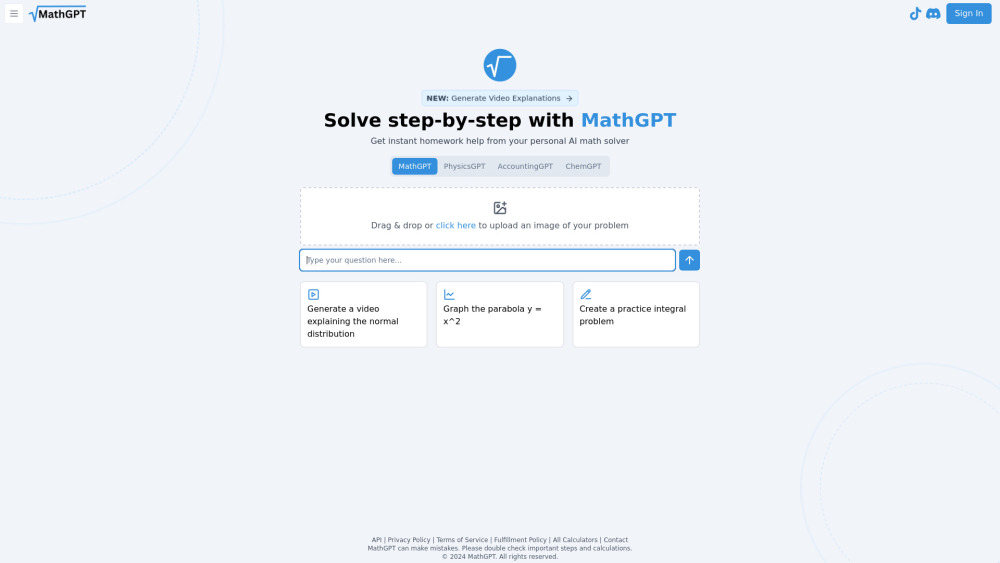
AI math solver and homework helper with video explanations and step-by-step solutions.

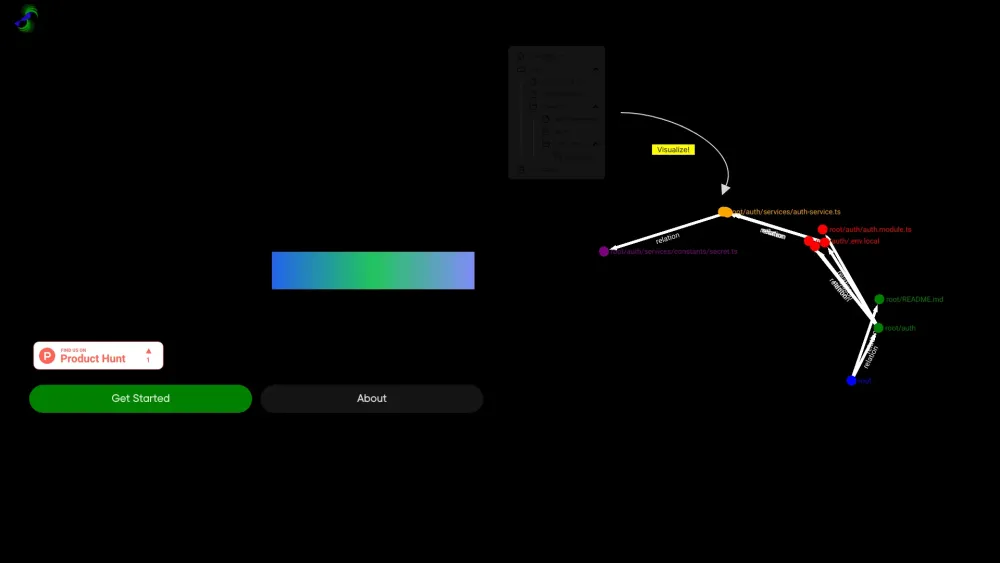
AI tool visualizing codebases as network graphs, aiding open-source contributions.

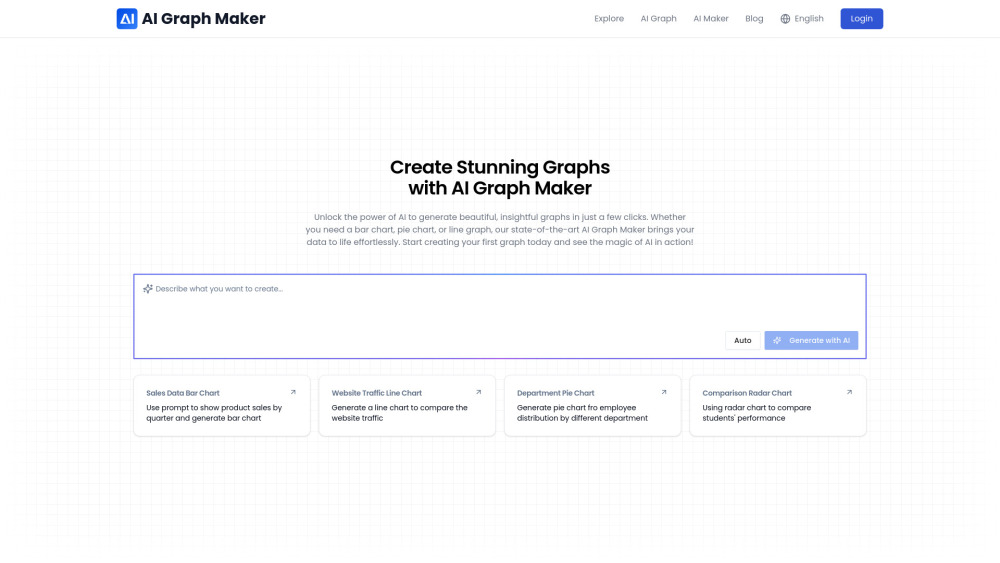
AI-powered tool to create stunning data visualizations effortlessly and quickly.

STEP 1 is an AI-based Web3 user graph for reward optimization using big data.


Opennote is a deep research and open notes platform for students with AI-powered tools.