Graphy For Data Storytelling
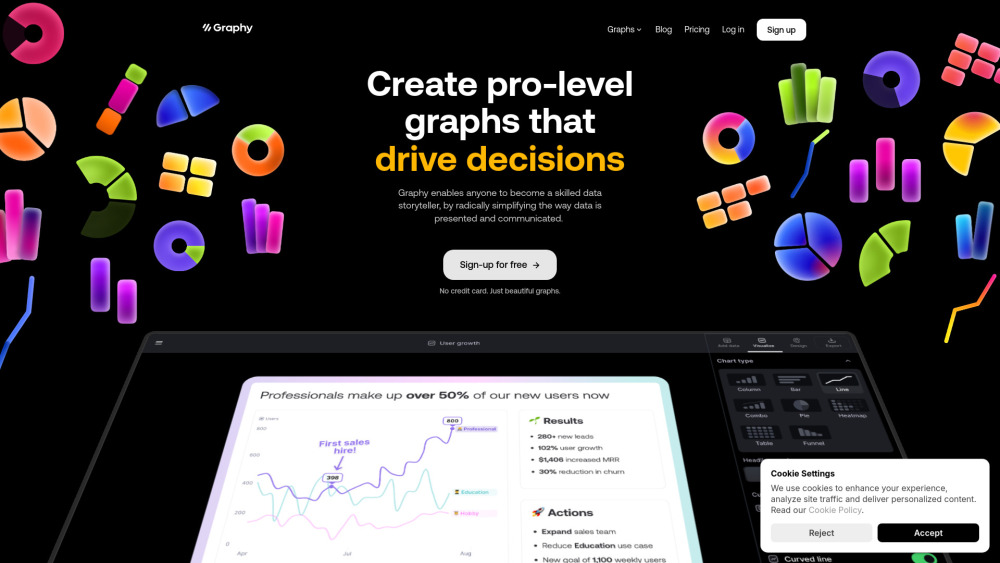


Graphy enables anyone to become a skilled data storyteller by radically simplifying the way data is presented and communicated. It allows users to create pro-level graphs that inspire actions, drive decisions, impress audiences, keep everyone aligned, and convince stakeholders. Trusted by 100,000+ users, Graphy offers AI-generated insights and graphs, connecting to Google Sheets and other data sources. It's built for modern teams, offering lightning-fast data visualization and easy-to-use interfaces.
Graphy simplifies data storytelling with easy, fast, and beautiful graph creation for everyone.
- Creating marketing reports
- Driving decisions with data
- Internal reporting and board memos
- Quickly creating visuals for newsletters and social feeds
- Consulting business presentations
- Users can add their data to Graphy
- and the AI will create a chart and explain key insights. Graphs can be presented in slides or pasted into Slack. Data can be connected from Google Sheets or pasted from anywhere.

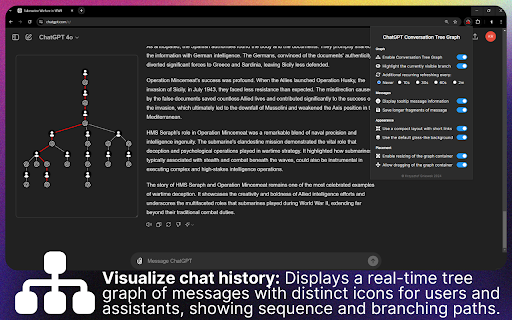
A ChatGPT extension visualizing conversation flow with a dynamic, interactive tree graph.

Web-based platform for software development and version control using Git.

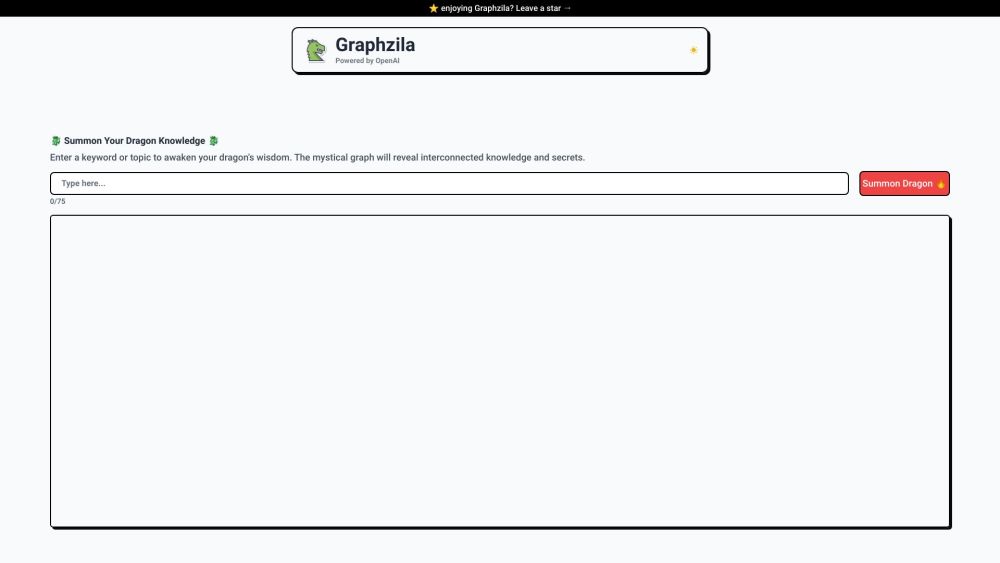
Graphzila creates knowledge graphs from text using OpenAI's GPT-3.5 Turbo.

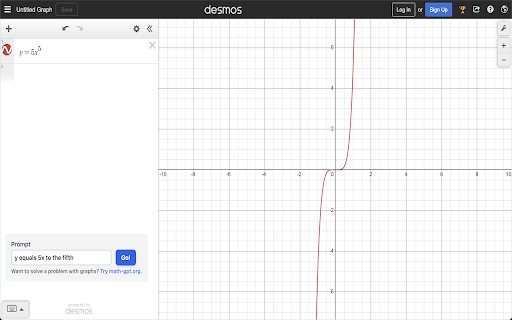
MathGPT graphs functions on Desmos and solves integrals and derivatives using AI.

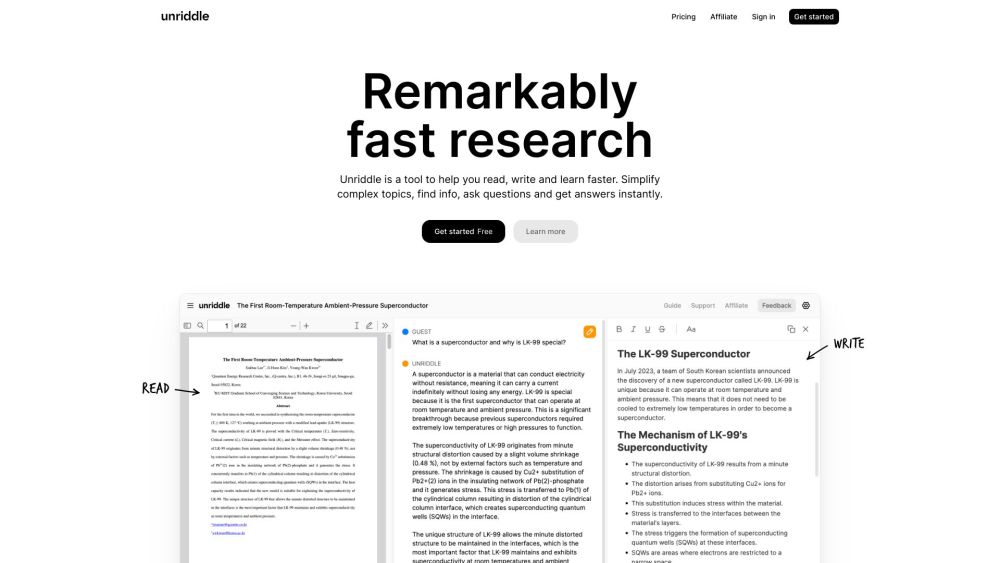
An AI research assistant to understand, organize, and write scientific documents faster.

AI-powered tool to generate flowcharts, graphs, and diagrams from various sources.


AI-powered tool to create stunning data visualizations effortlessly and quickly.
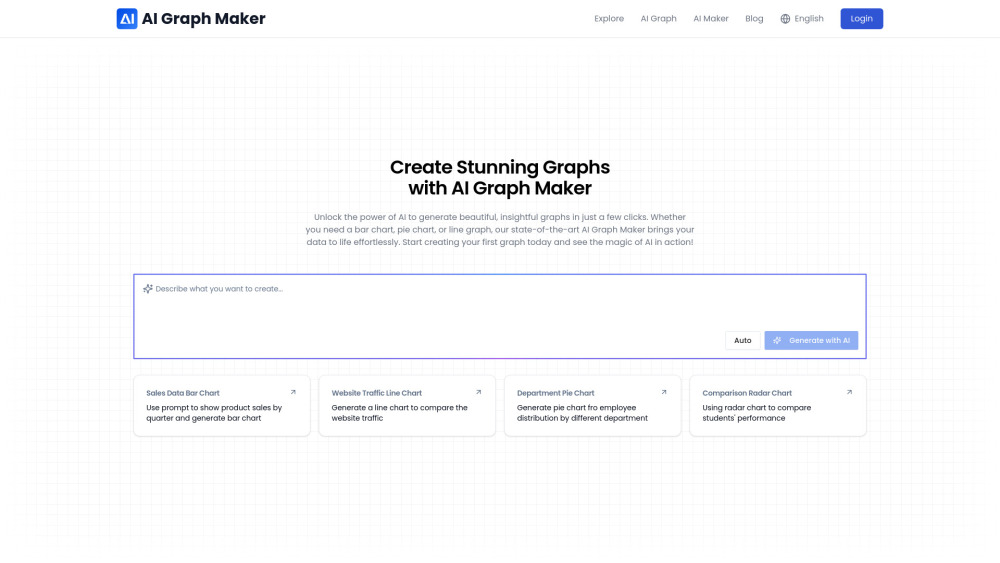
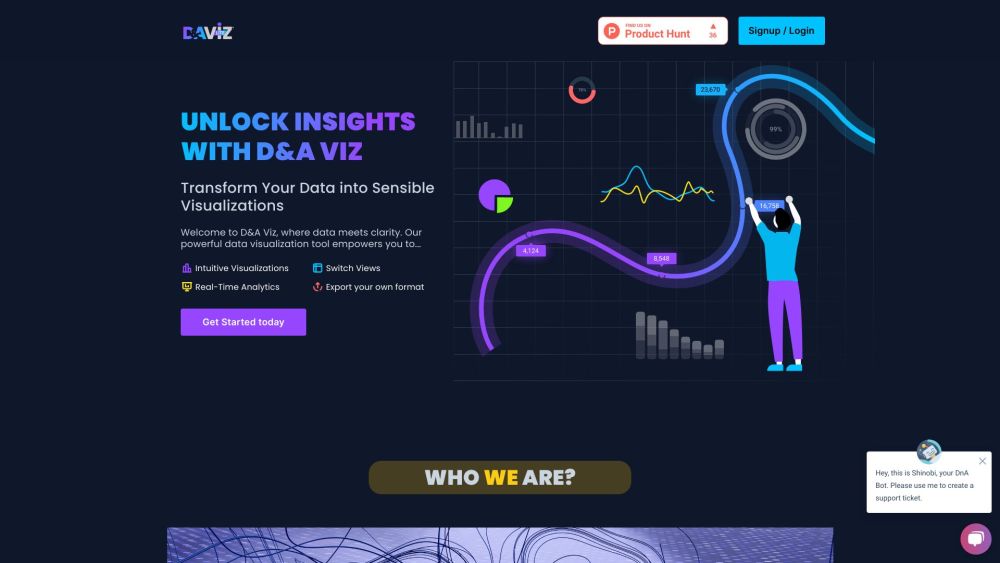
AI tool transforming raw data into visual insights for informed decisions.

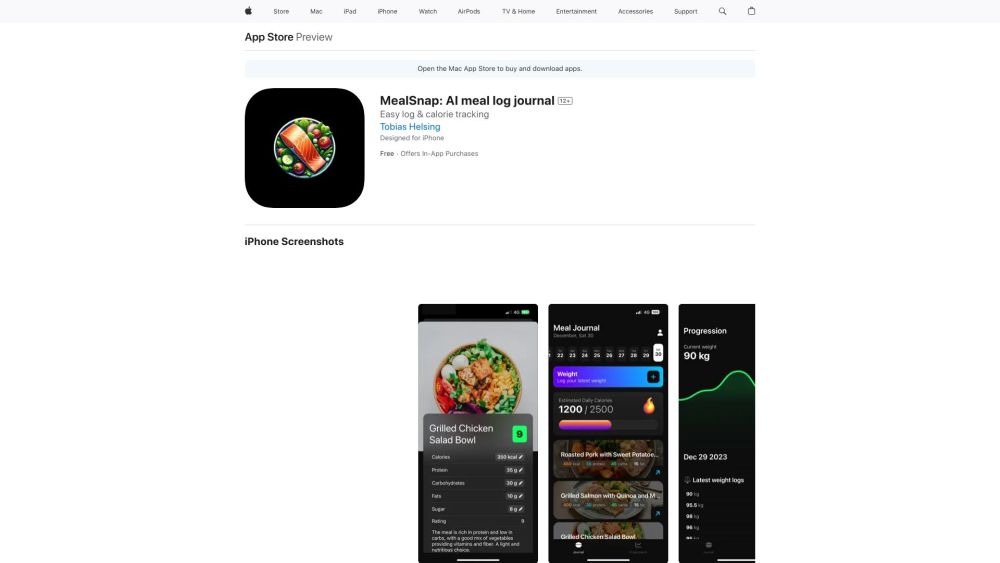
AI-powered meal logging and calorie tracking iPhone app.