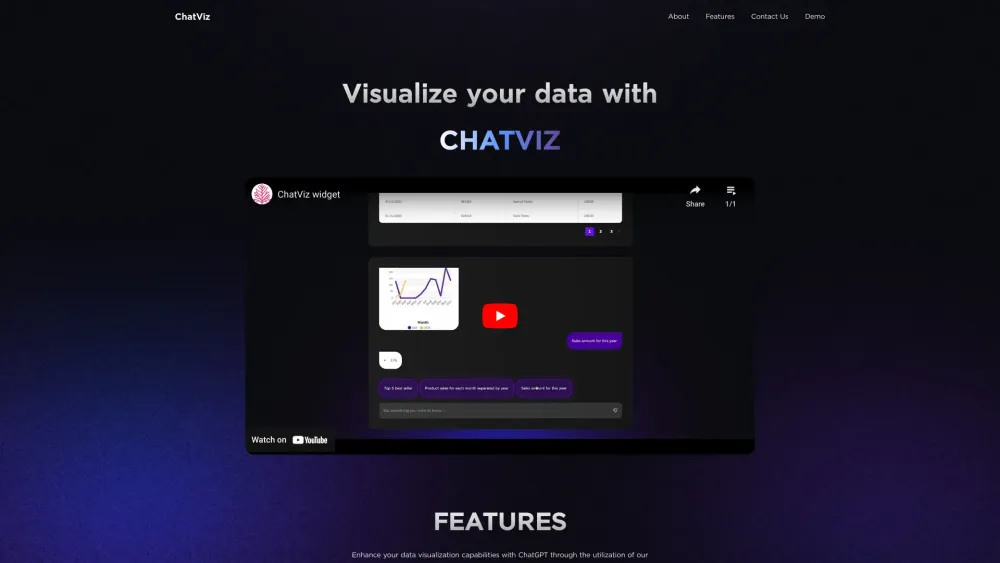


ChatViz is a powerful developer tool designed to visualize data using ChatGPT. It offers easy integration, security, and is available for free. ChatViz enhances data visualization capabilities with ChatGPT, providing features like SQL translation and chart suggestions to optimize development time and user experience.
A developer tool to visualize data using ChatGPT.
- Enhance data visualization capabilities with ChatGPT
- Generate SQL queries from prompts
- Automatically generate charts tailored to datasets
- 1. Configure your SQL schema to ChatViz. 2. Set up your webhook to connect with ChatViz. 3. ChatViz will visualize the output data from your webhook.

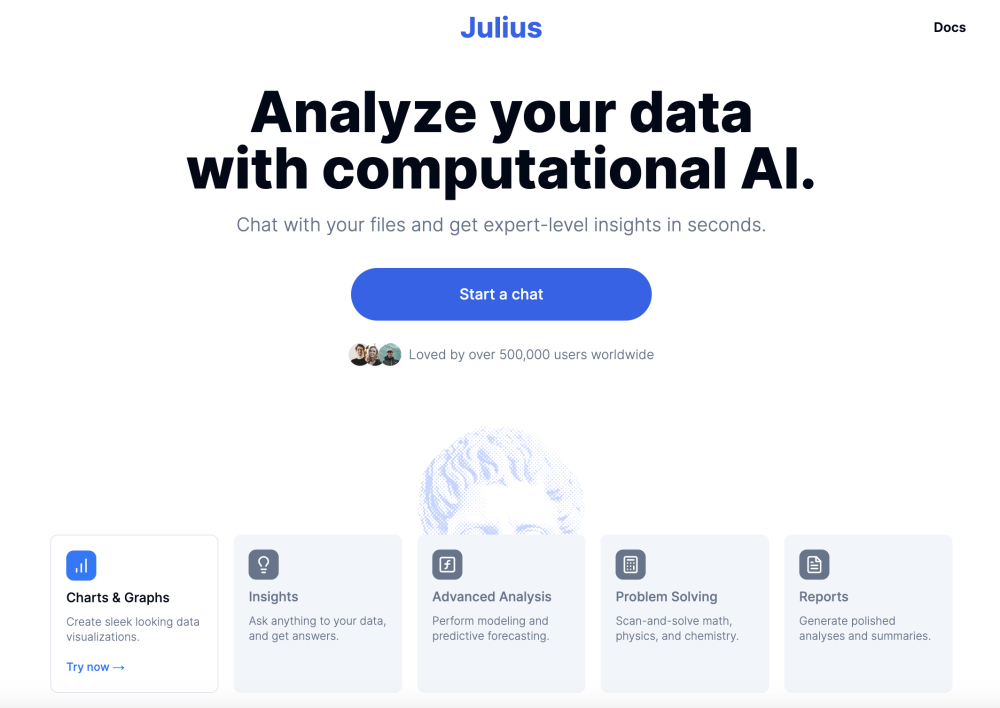
AI data analyst for data analysis and visualization.

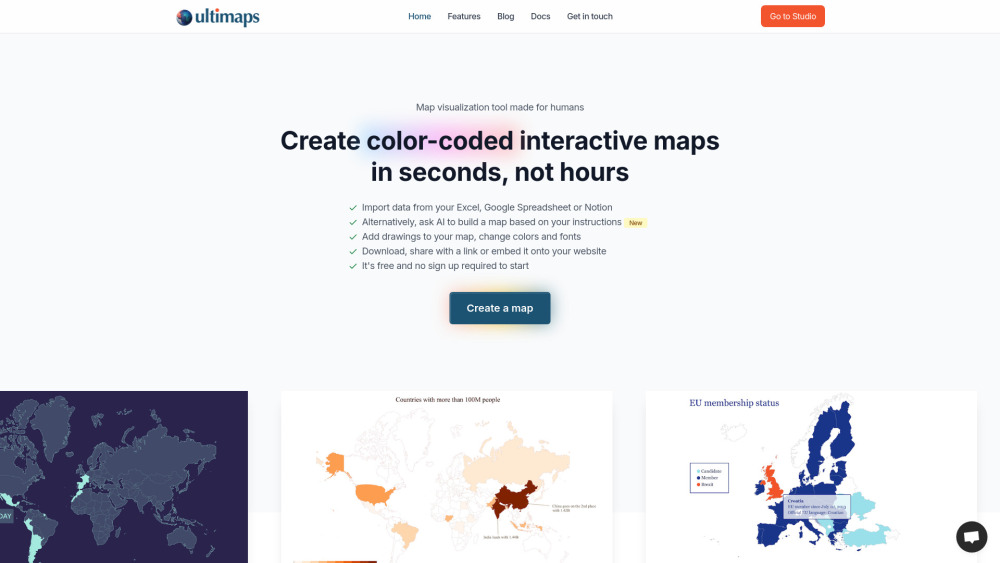
Map visualization tool for creating interactive and custom maps from data or prompts.
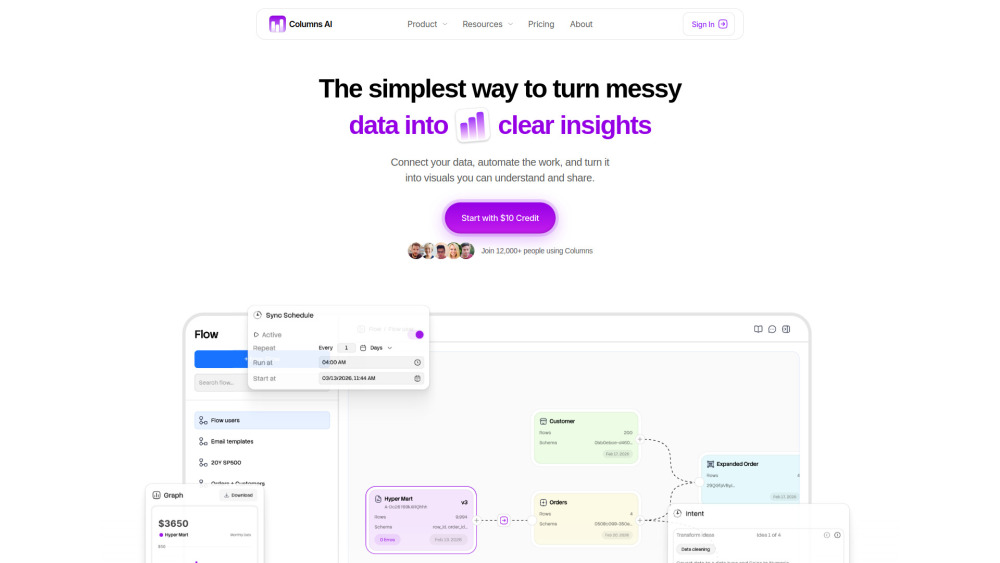
AI-powered platform for automated data cleaning, visualization, and storytelling.

AI-powered platform for creating, editing, and discussing UMLs and workflows.


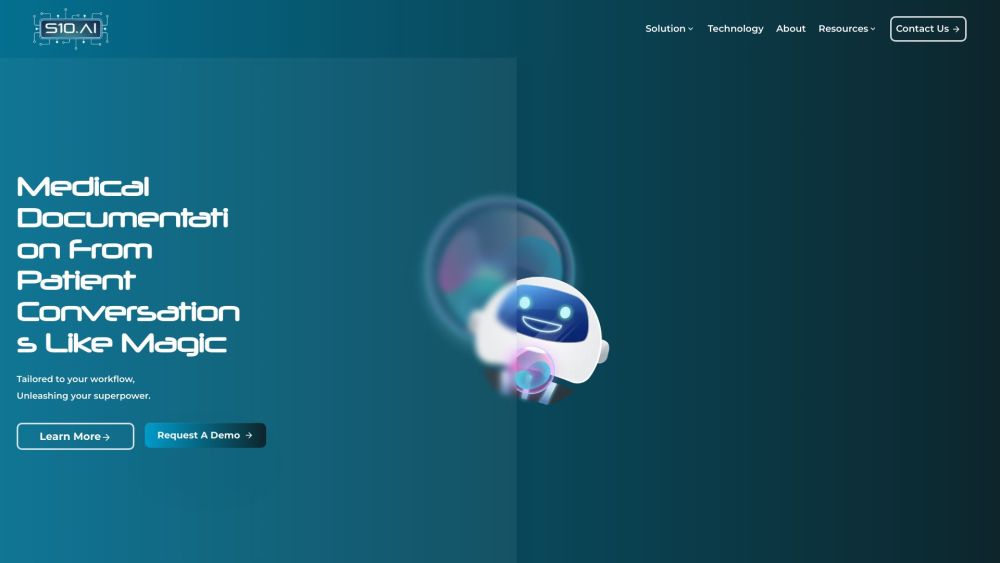
AI Medical Scribe for accurate, real-time clinical notes, boosting efficiency and reducing burnout.

Napkin AI turns text into visuals for effective business storytelling.


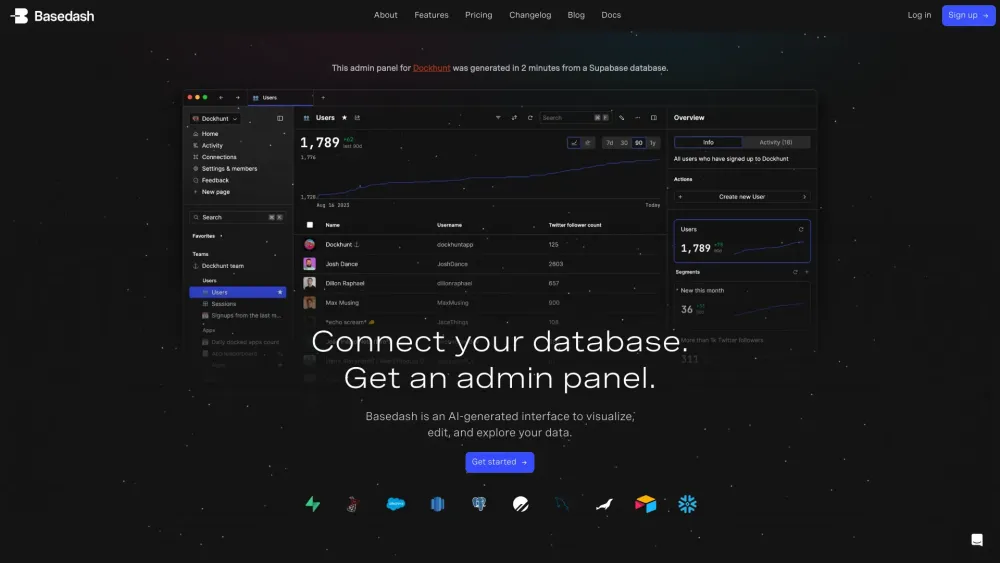
AI-powered business intelligence platform for data visualization and querying using natural language.

AI chart generator for professional data visualizations from natural language.


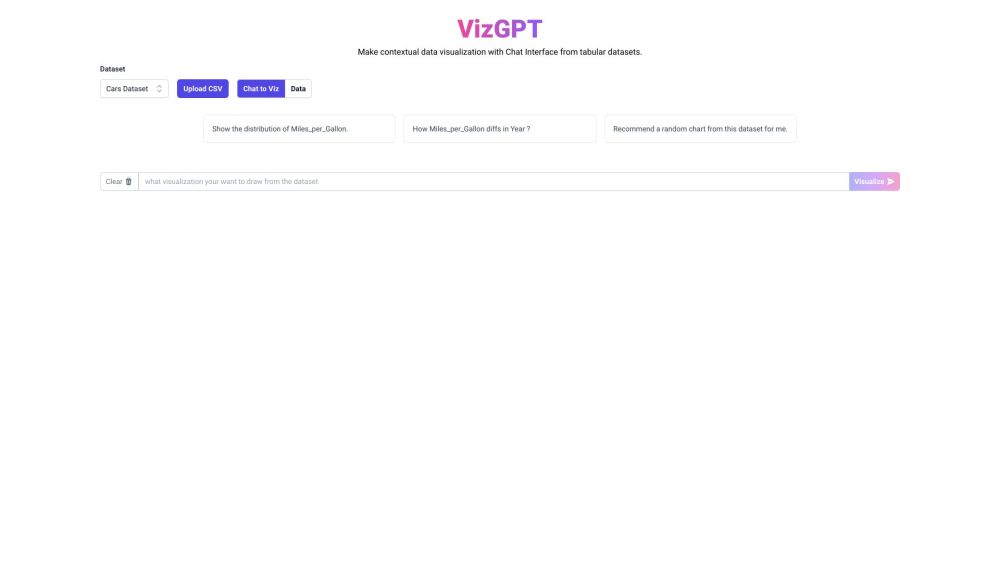
AI tool for generating visualizations from natural language queries and datasets.