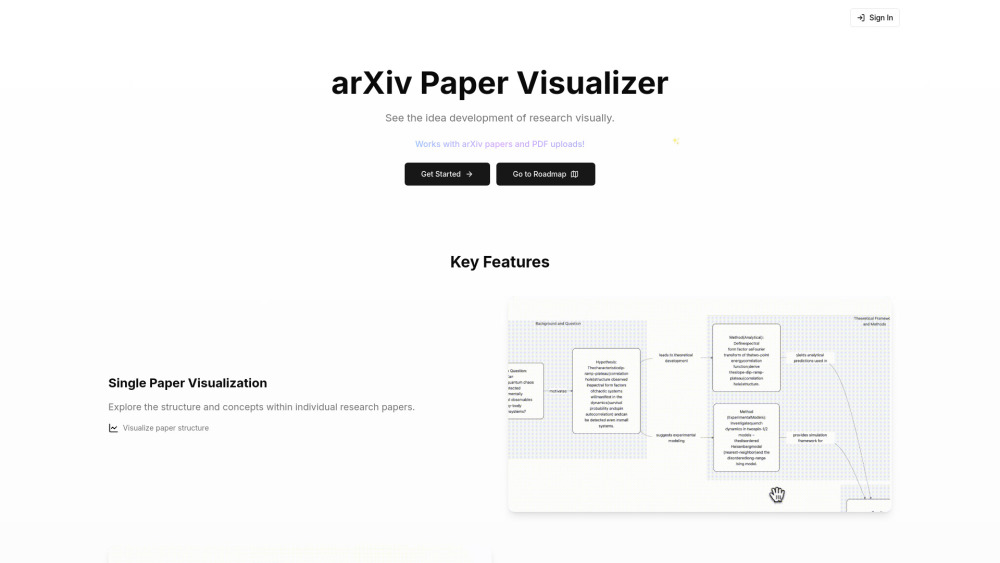
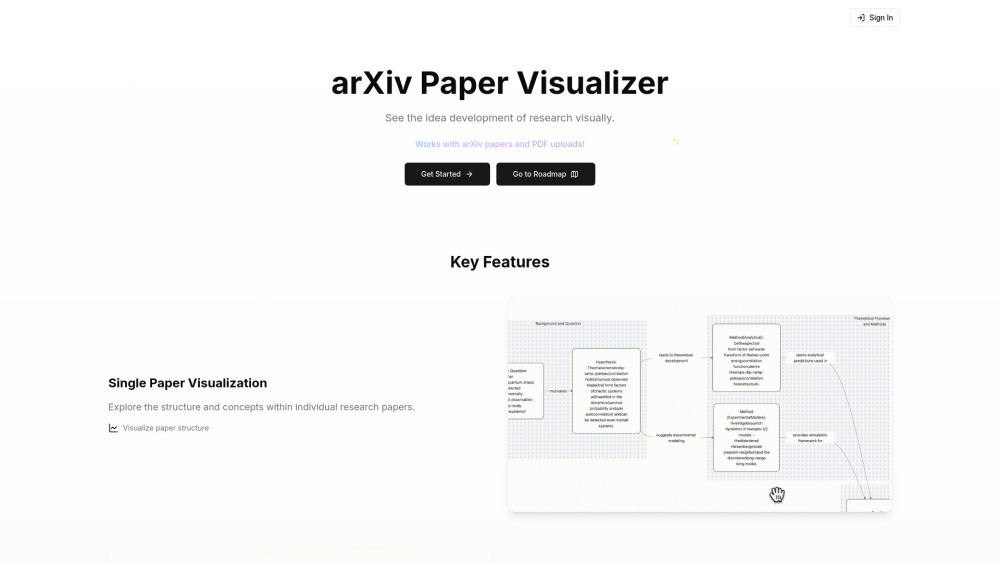




Paper Visualizer is a tool designed to help researchers understand and digest complex academic papers more efficiently. It transforms research papers into visual knowledge, allowing users to visualize steps of proof, untangle literature reviews, and explore relationships between different works. It works with arXiv URLs and PDF uploads, providing interactive visualizations to enhance comprehension and collaboration.
Transforms research papers into visual knowledge for better understanding and collaboration.
- Mapping research connections to understand relationships between papers.
- Breaking down complex methods and mathematical proofs into step-by-step diagrams.
- Getting a quick visual overview of a paper's structure and key ideas.
- Customizing visualizations with AI assistance.
- To use Paper Visualizer
- simply upload a PDF of a research paper or paste an arXiv URL. The AI will analyze the paper's content
- structure
- and relationships to create visual representations. Users can then interact with these dynamic visualizations and share them with colleagues or students.

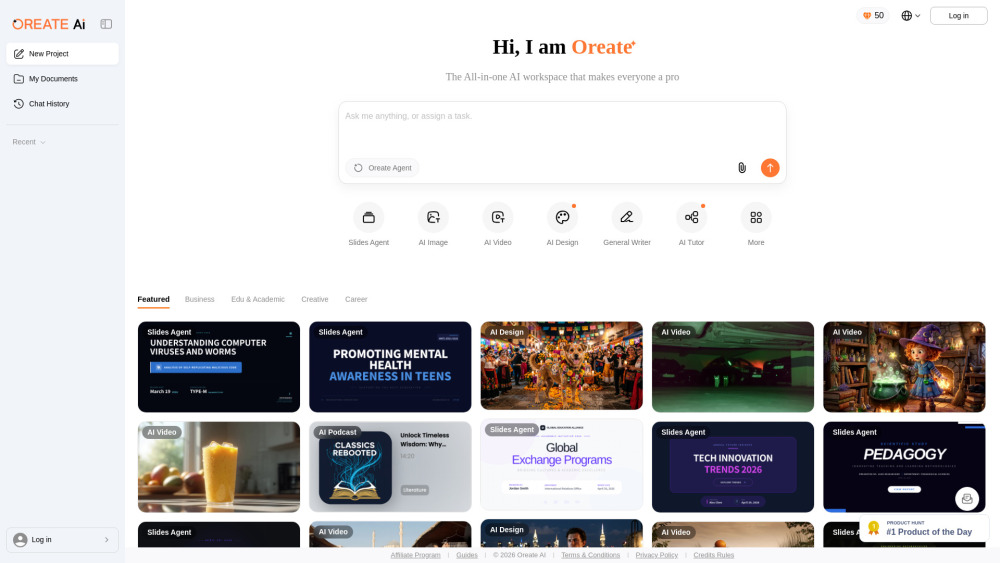
All-in-one AI Workspace: Create professional slides, essays, videos, images, podcasts, and deep research in minutes.

Platform for streamlined decision-making with AI and knowledge management.


An ontology-centered Graph RAG platform that structures documents into reusable AI knowledge packs.


A global patent search and analysis platform with comprehensive IP services.


AI-driven financial knowledge graph for real-time market insights.


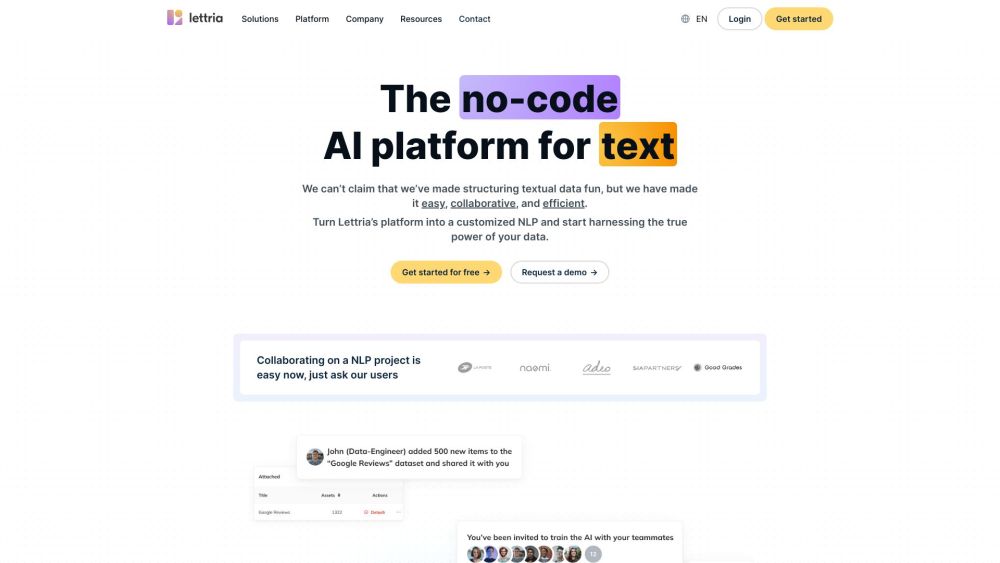
Lettria transforms unstructured data into structured knowledge using AI and GraphRAG.

Venturefy uses AI to map and verify corporate relationships, creating a public database.


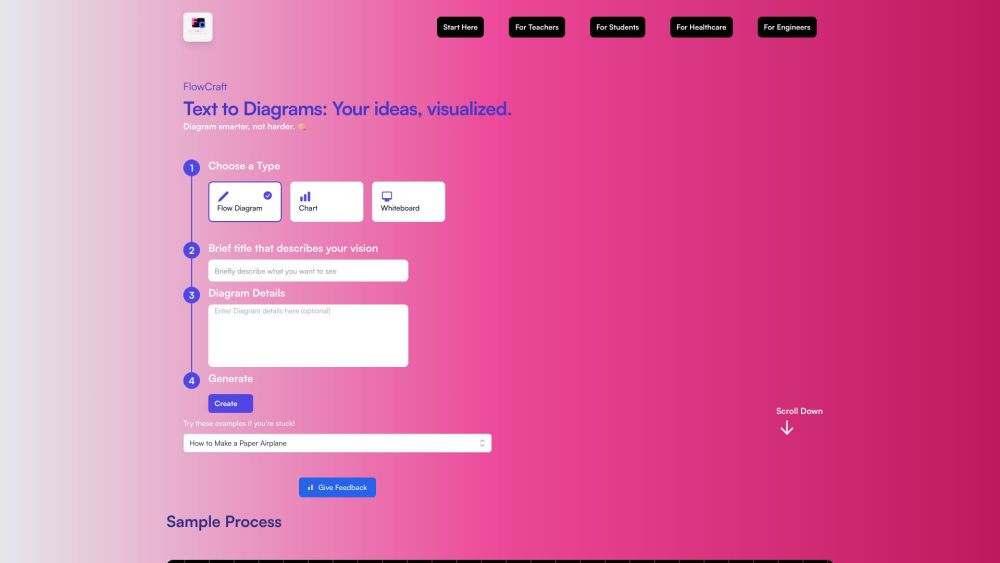
AI-powered diagramming tool for flowcharts, process maps, and system diagrams.

AI text analysis tool using network visualization and GPT-3 to generate insights.