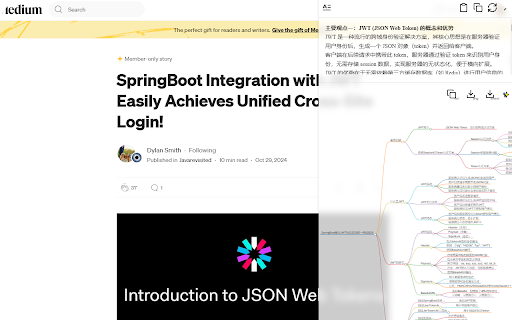




Summaixt ai chrome extension? Summaixt is a Chrome extension designed to provide AI-powered text summarization and mind mapping functionalities. It allows users to quickly generate summaries and mind maps from web page content, enhancing productivity and information processing.
Chrome extension for AI text summarization and mind mapping.
- Summarizing articles and web pages for quick understanding
- Creating mind maps to visualize and organize information from web content
- Install the Summaixt extension
- navigate to any webpage
- click the '+' icon in the top right corner
- and select either the text summarization or mind map function to process the page content.

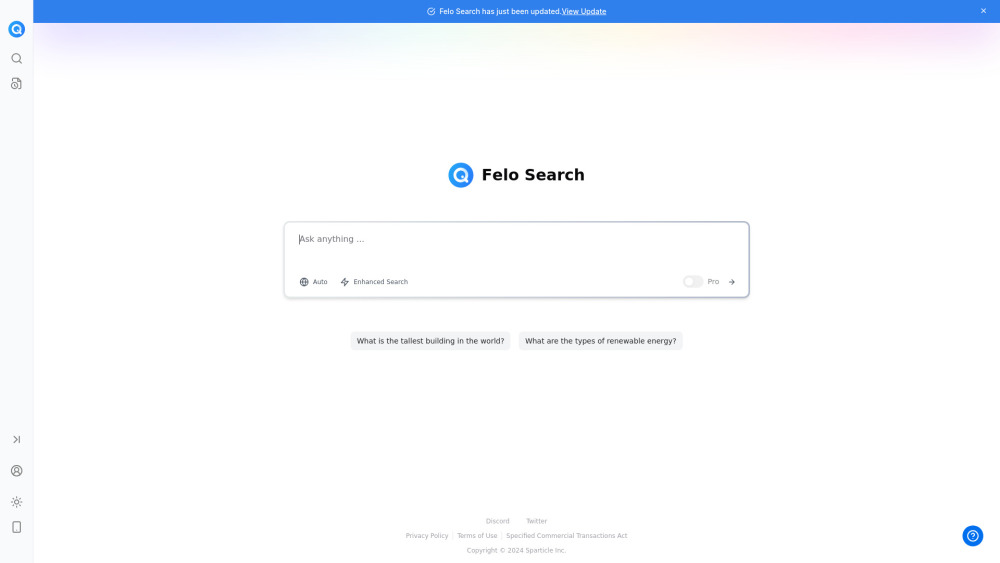
Free AI search engine with multilingual support and AI creation tools.

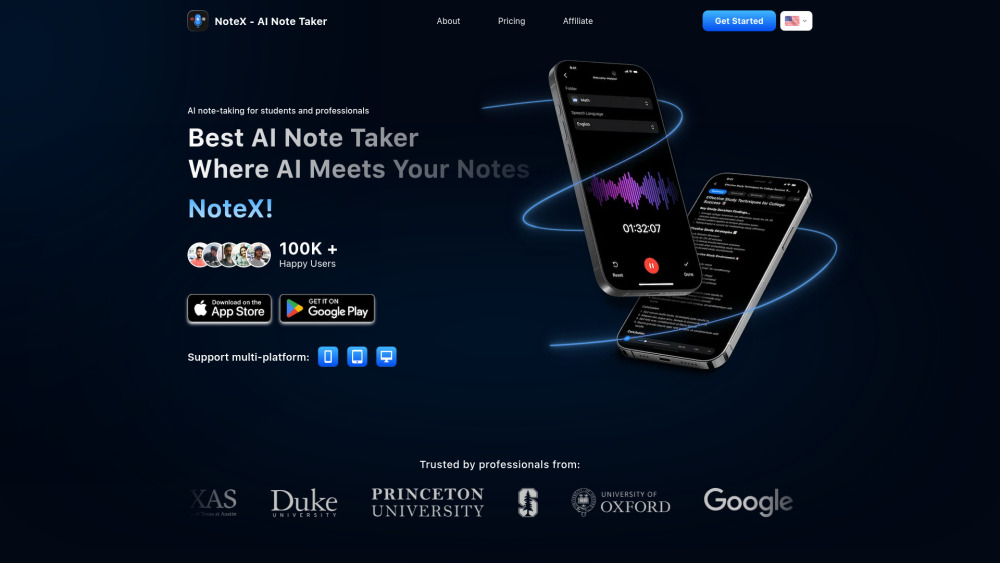
AI note-taking app that transforms content into smart study material.

AI-powered mind mapping tool for visualizing and organizing ideas.

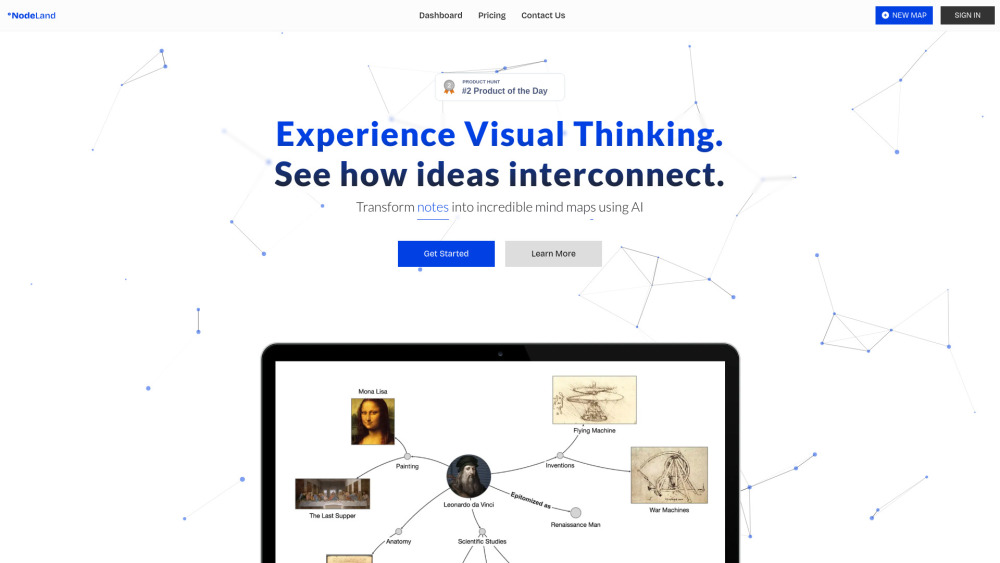
NodeLand is a mind-mapping and note-taking app with AI assistance, creating dynamic mind maps.

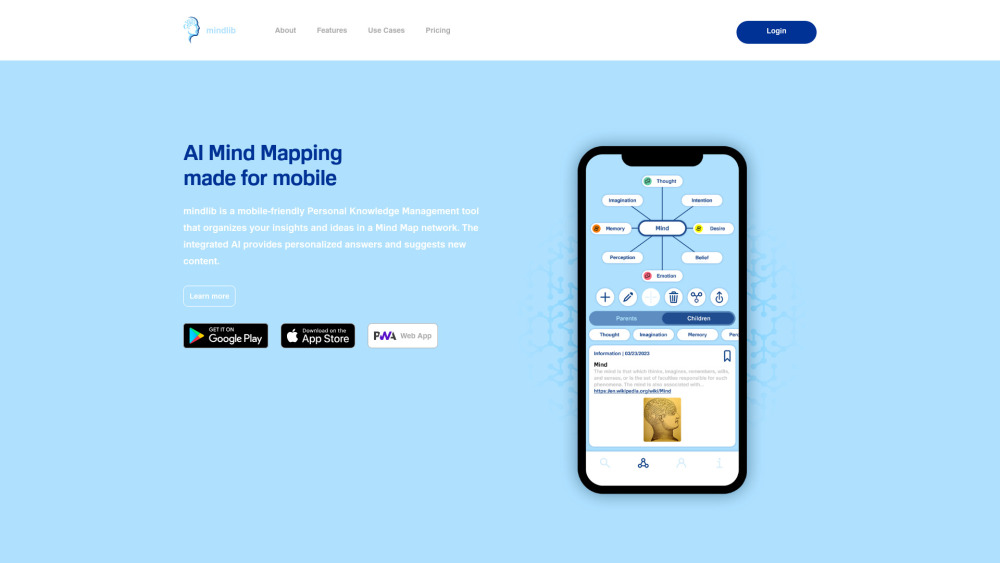
Graph-based Personal Knowledge Management tool with AI mind mapping and chat.

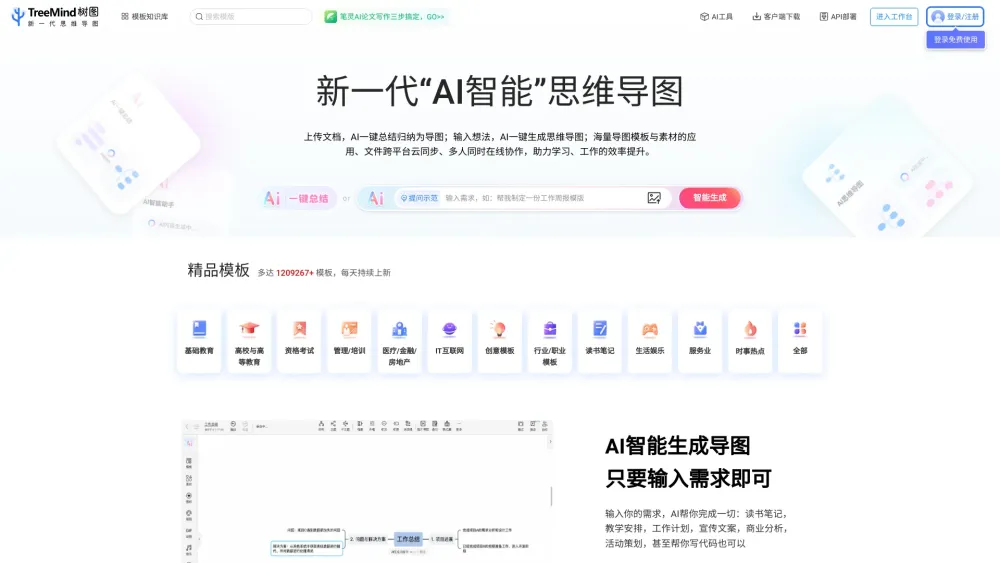
Online AI mind mapping software with free templates for brainstorming and planning.

AI tool that transforms content into mind maps for learning and creative processes.
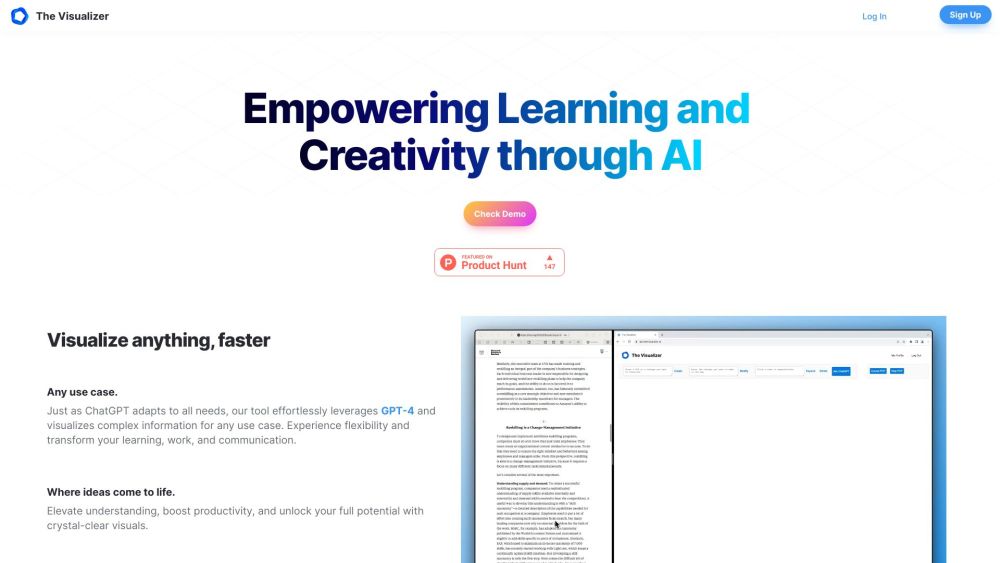

AI platform for creating study guides from various content types.
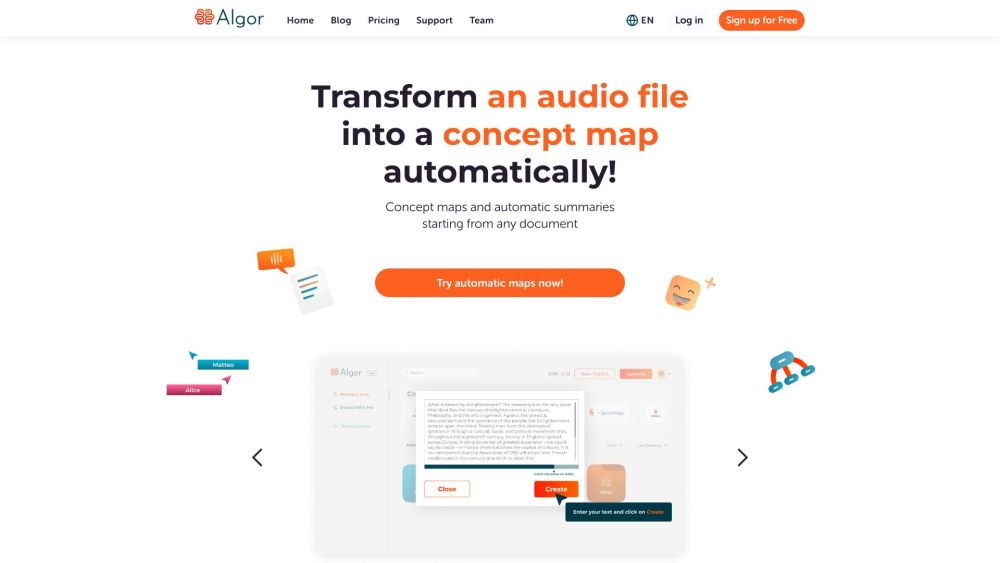

AI-powered mind mapping tool for summarizing content from various formats and languages.
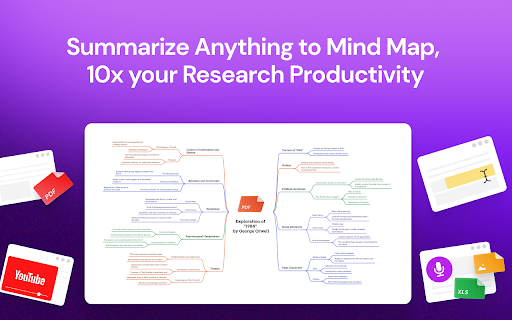

AI-powered mind mapping tool for brainstorming, organizing, and presenting ideas.
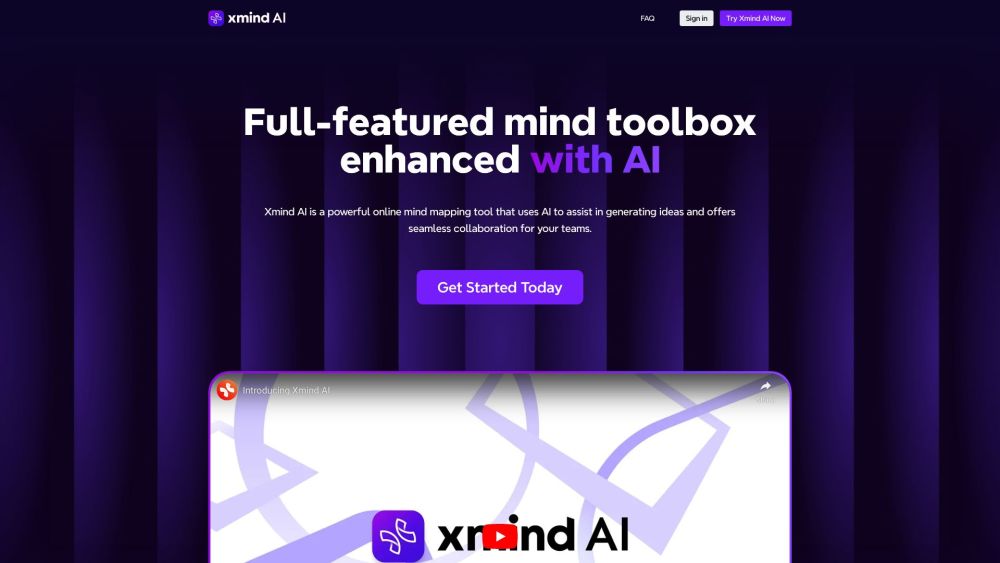

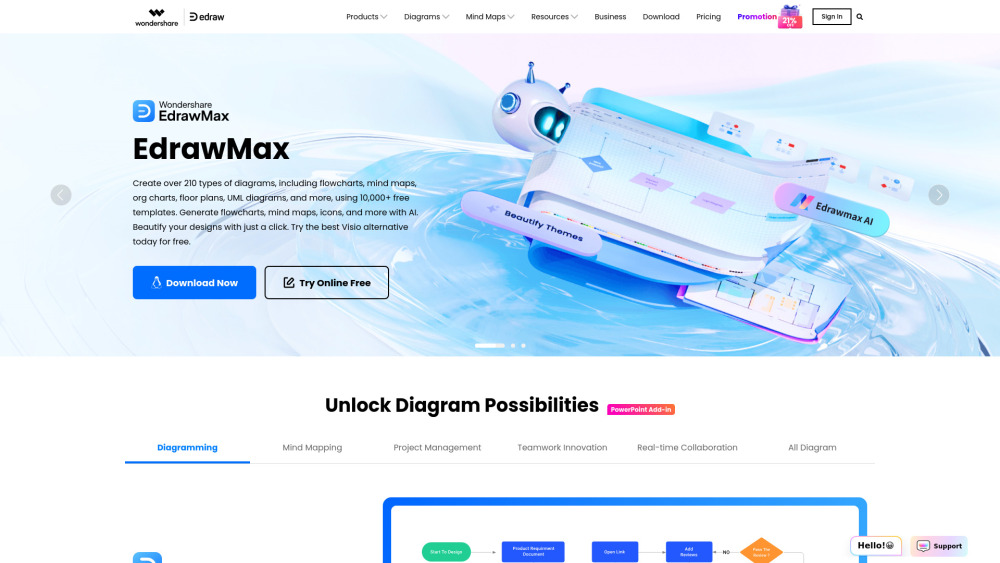
Diagramming software with templates for flowcharts, mind maps, org charts, and more.
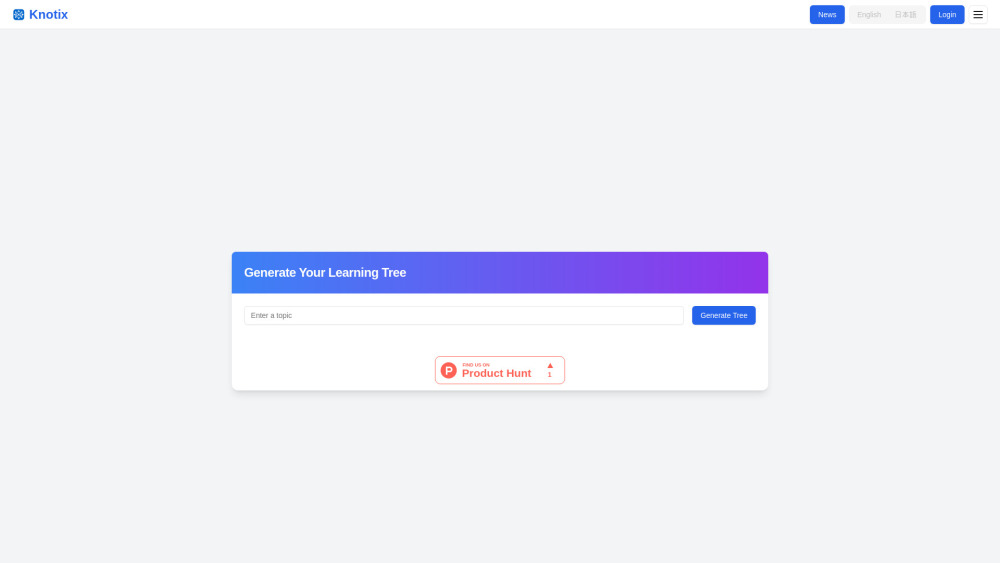
AI-powered tool for visual knowledge mapping and insight discovery.

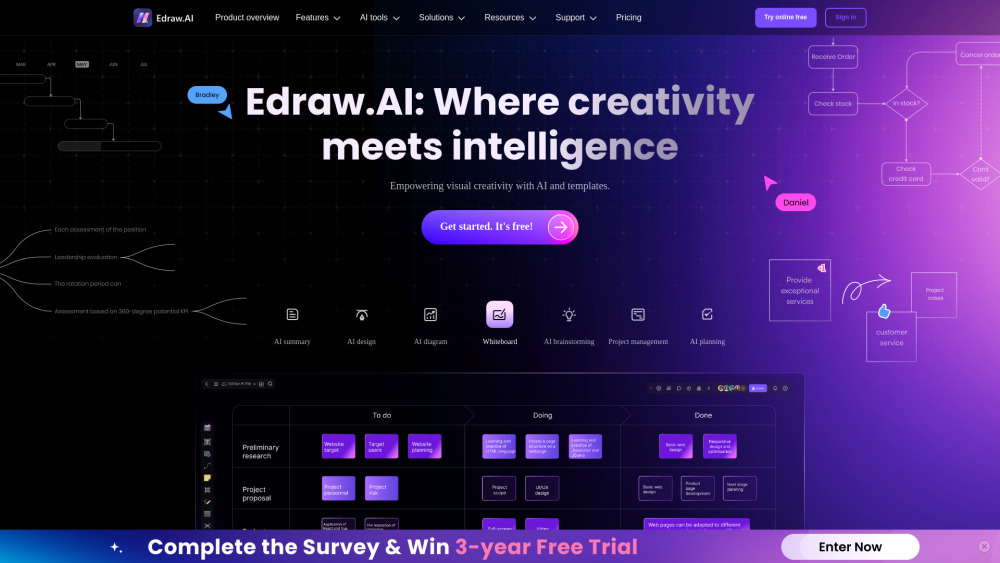
AI-powered visual collaboration platform for teamwork and project management.

AI-powered mind mapping tool for instant idea generation and brainstorming.
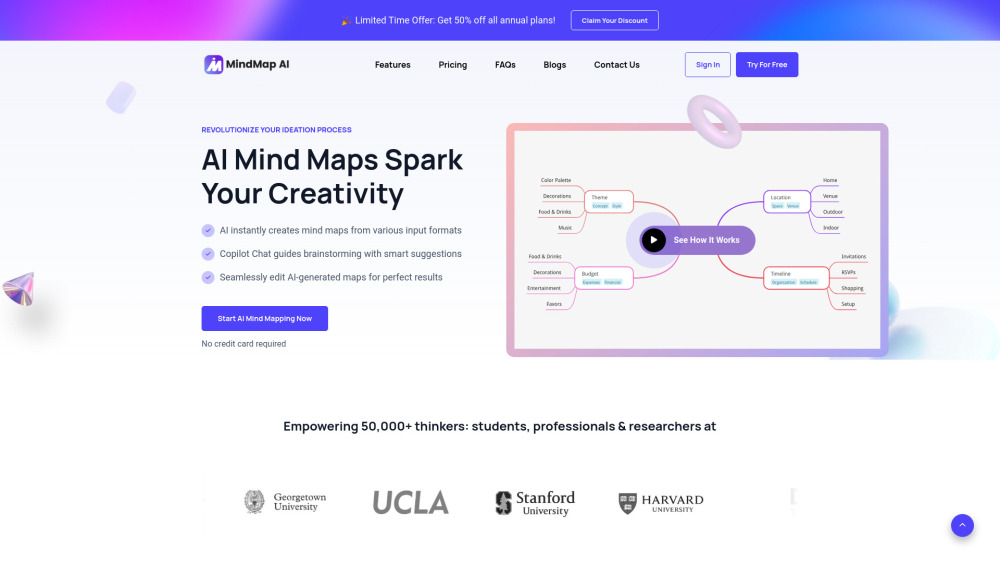

Podcast learning app with transcription, summarization, and knowledge management integration.
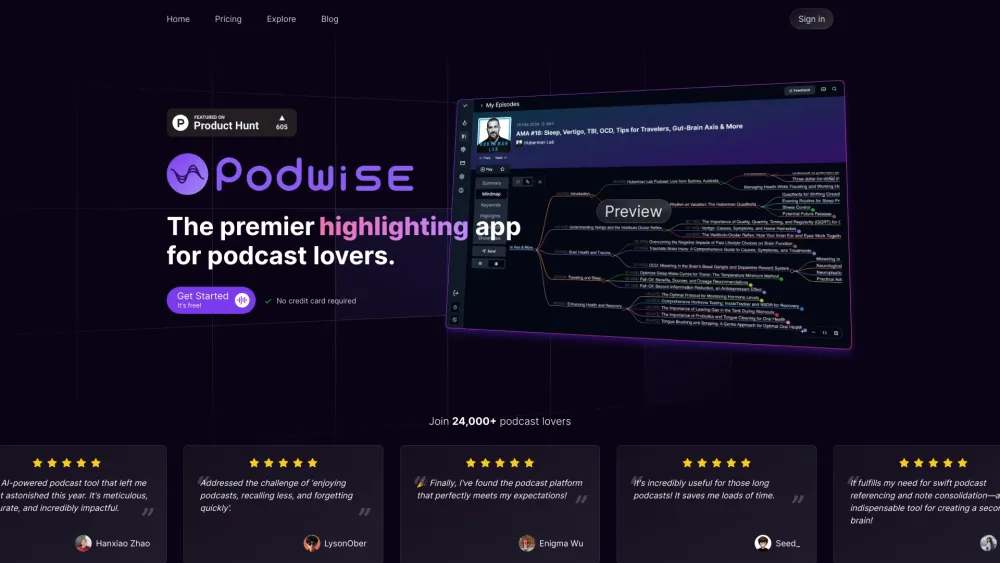

AI-powered mind mapping tool for visual learning and research.
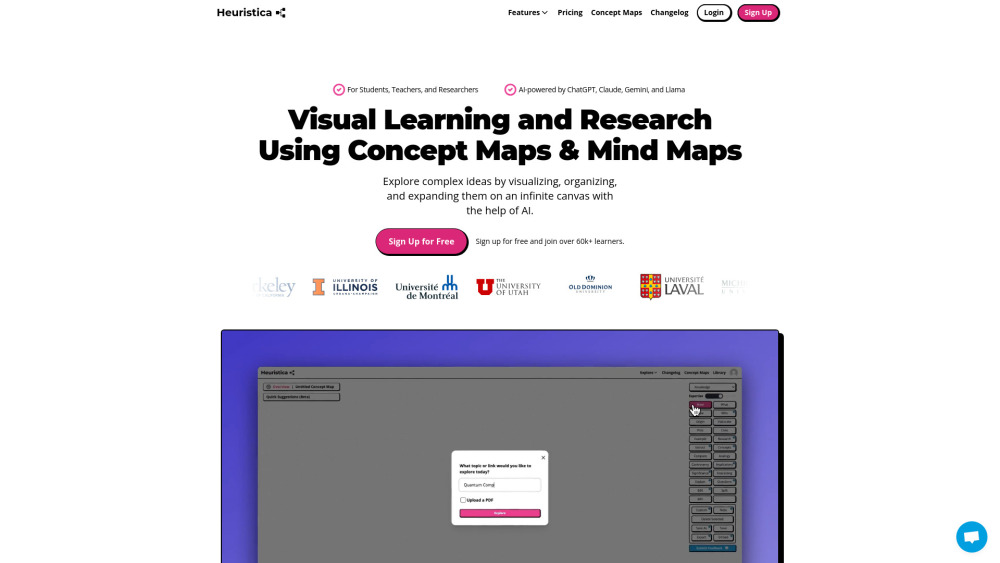

AI mind map generator & summarizer for diverse content.

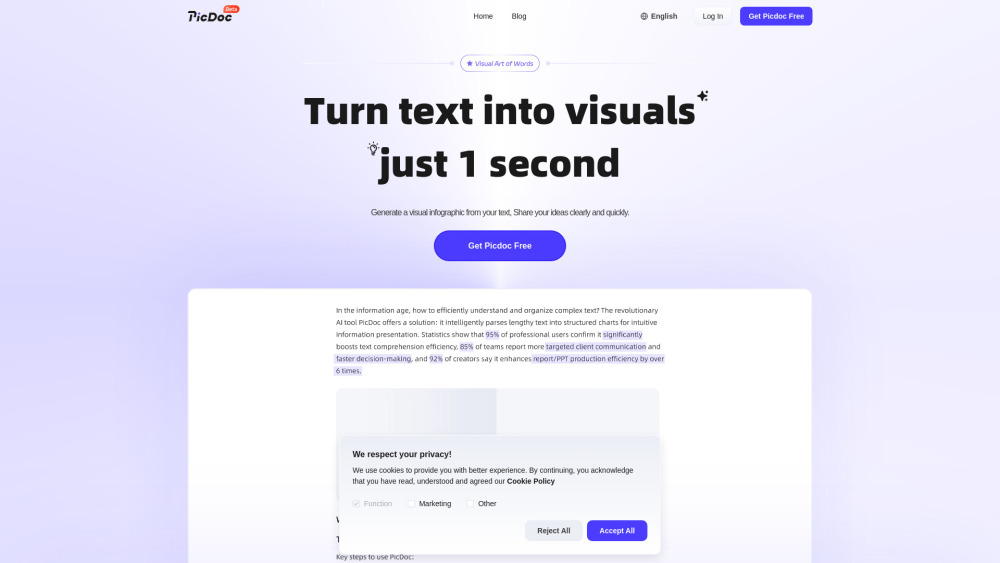
AI-driven tool converting text to visual content like charts and infographics.