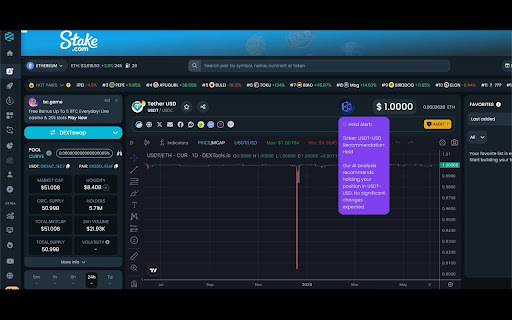
Chartcool




ChartCool is an AI-powered chart generator and online data visualization tool designed to create professional charts from natural language prompts. By uploading data and describing visualization needs, users can quickly generate polished charts and receive automated data insights without writing code. It supports one-click exporting to crisp PNG images, PDFs, and Excel spreadsheets, making data storytelling simple and efficient.
AI chart generator for professional data visualizations from natural language.
- Generating quick quarterly sales comparison bar charts with automated performance insights.
- Turning regional tables into interactive geographic map visualizations for global reports.
- Creating stock or futures price movement visualizations using Candlestick charts for financial analysis.
- To use ChartCool
- upload your data file or paste your dataset into the tool. Type a natural language description detailing what you want to visualize (e.g.
- 'Create a quarterly sales comparison bar chart')
- and the AI will analyze the data
- select the best chart type
- and generate the visualization alongside professional data insights. Once generated
- you can export the chart into formats like PNG
- or Excel.

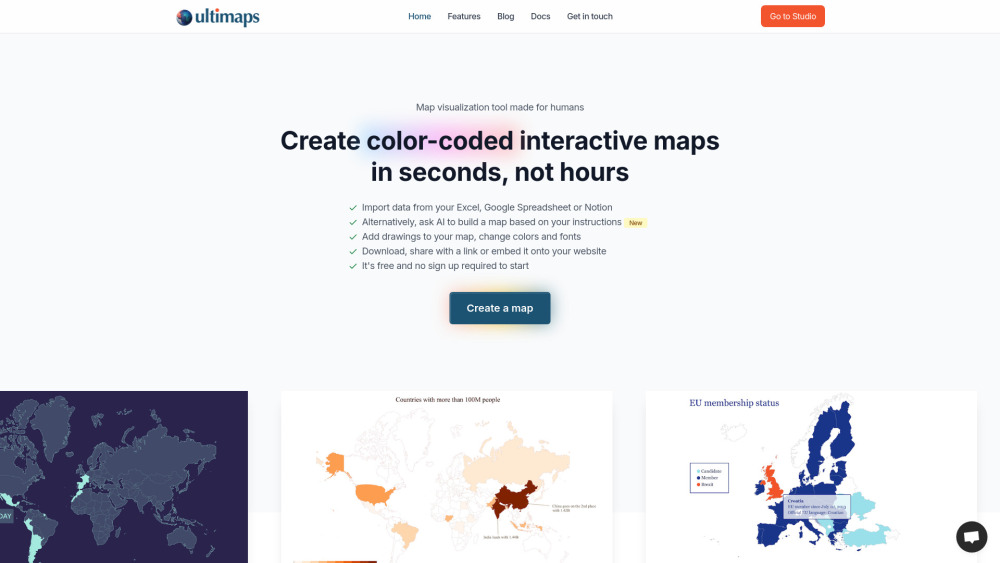
Map visualization tool for creating interactive and custom maps from data or prompts.

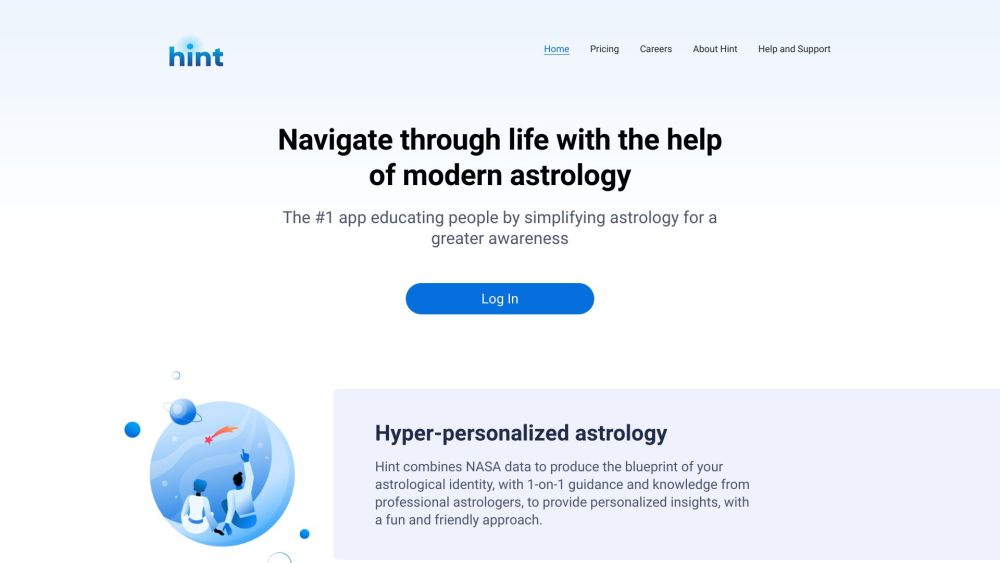
Hyper-personalized astrology & horoscope app with AI and expert astrologer guidance.

AI-powered platform for creating, editing, and discussing UMLs and workflows.


AI-native Business Intelligence Platform
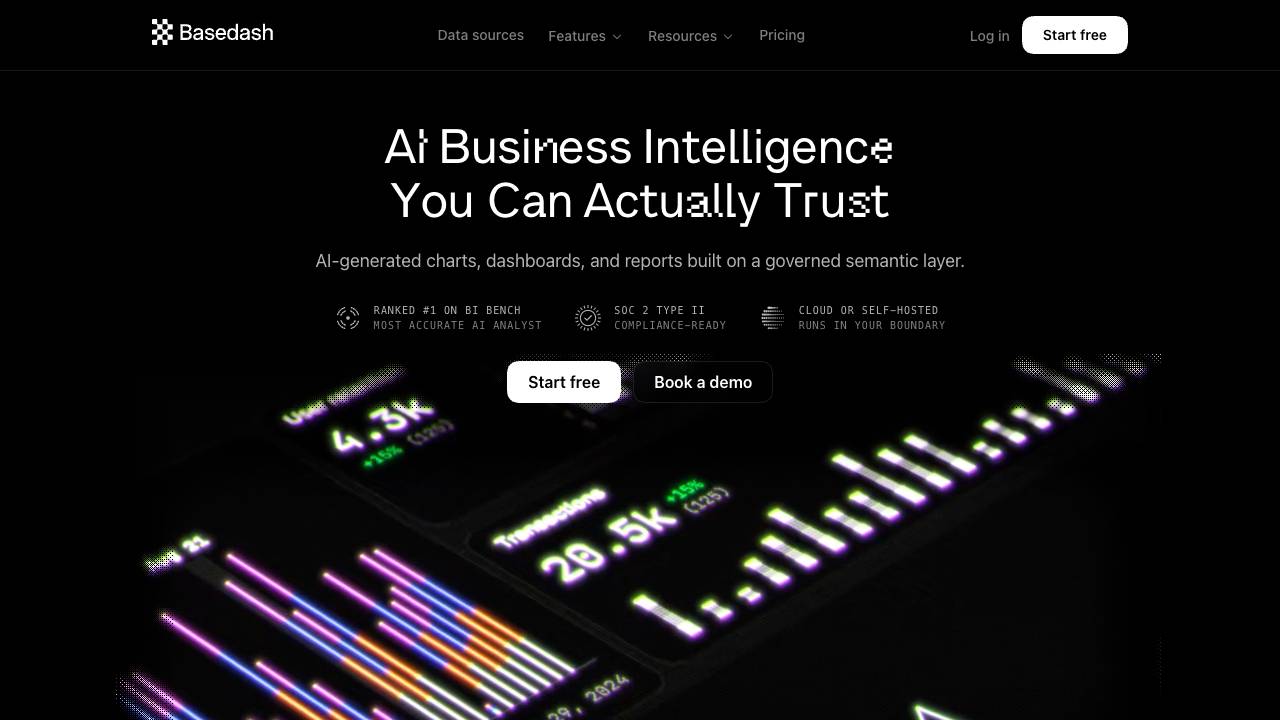

AI-assisted data analysis and visualization platform for instant insights.


ShenShu offers free BaZi analysis with AI-powered interpretations for insights into destiny.


AI-powered medical scribing and documentation tool for healthcare professionals.


AI-powered business intelligence platform for data visualization and querying using natural language.

ChartIQ AI provides AI-powered insights to enhance trading decisions and outcomes.