
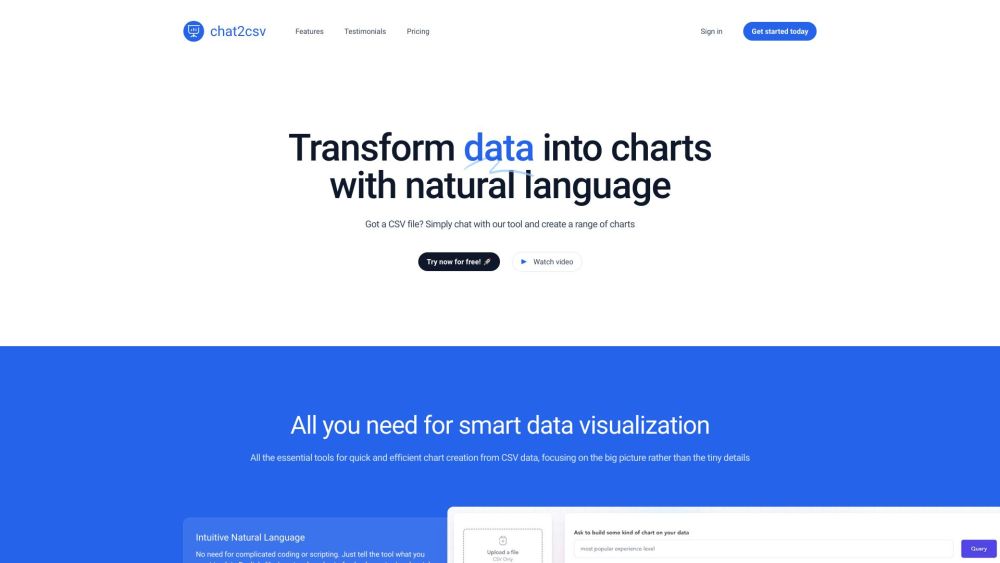


Chat2CSV is a data visualization platform that transforms CSV data into various types of charts using natural language processing. Users can simply 'chat' with the tool, asking for the chart they need. It offers easy data visualization with natural language, focusing on intuitive use and secure data handling. The platform supports a wide variety of chart types and provides AI support to suggest the best charts for data analysis.
Data visualization platform transforming CSV data into charts using natural language processing.
- Transforming sales data into bar charts by region
- Creating pie charts of product sales
- Generating scatter plots for data analysis
- Users upload a CSV file and then chat with the tool using natural language to specify the desired chart type (e.g.
- 'create a bar chart of sales by region'). The platform then generates the chart.

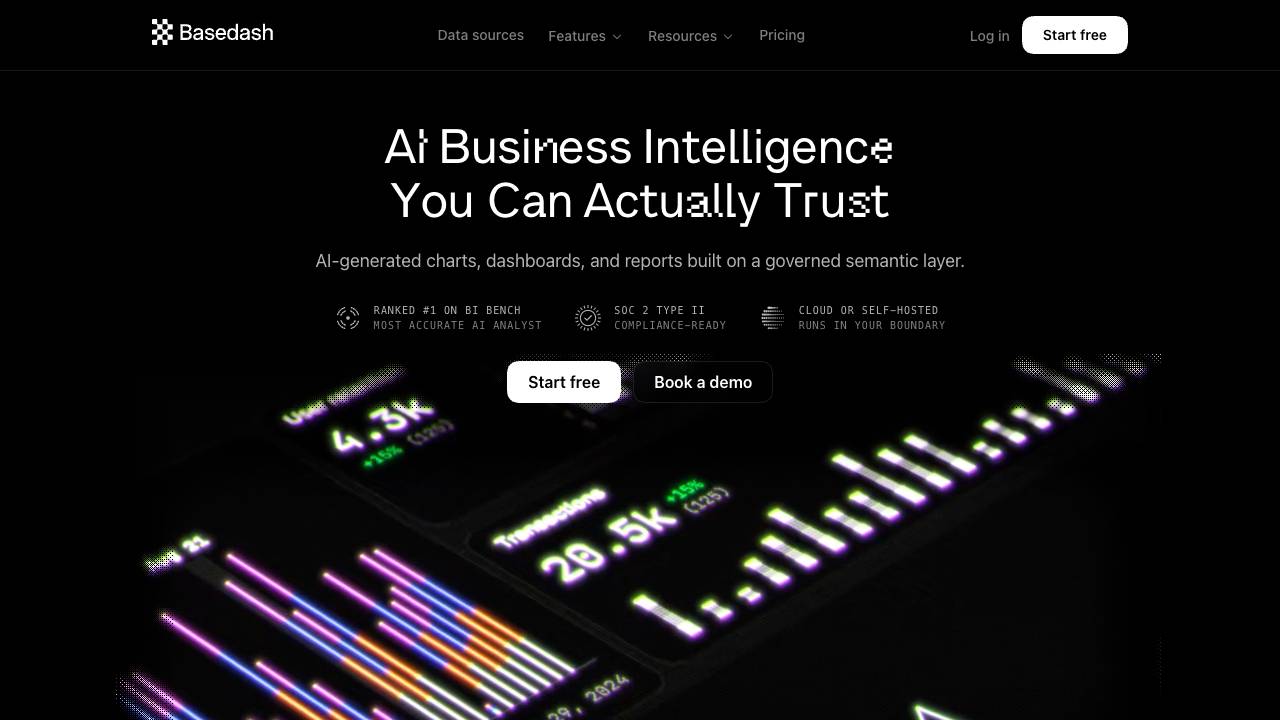
AI-native Business Intelligence Platform

Free AI Chart Generator that turns Data to Beautiful Charts in Seconds.
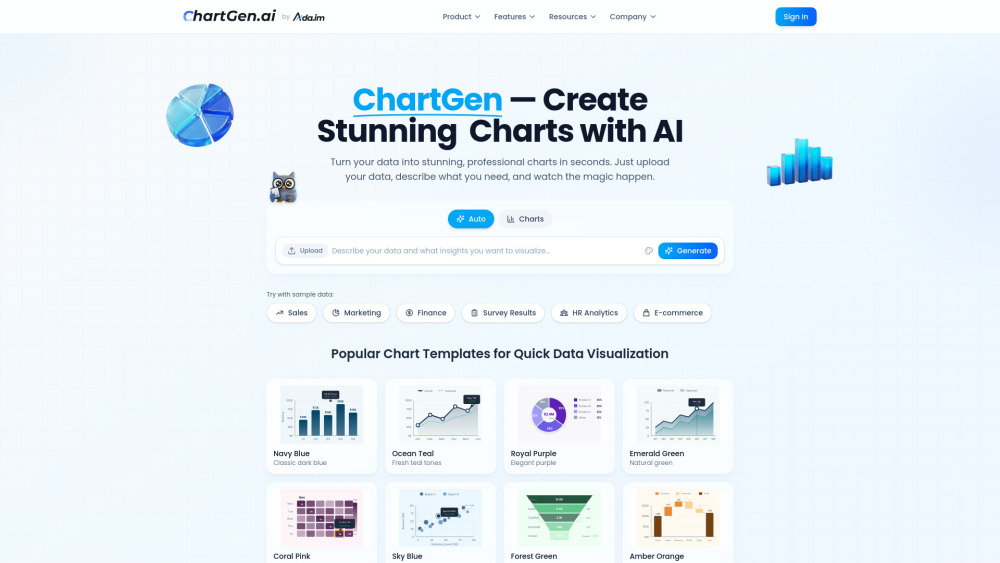

AI chart generator for professional data visualizations from natural language.


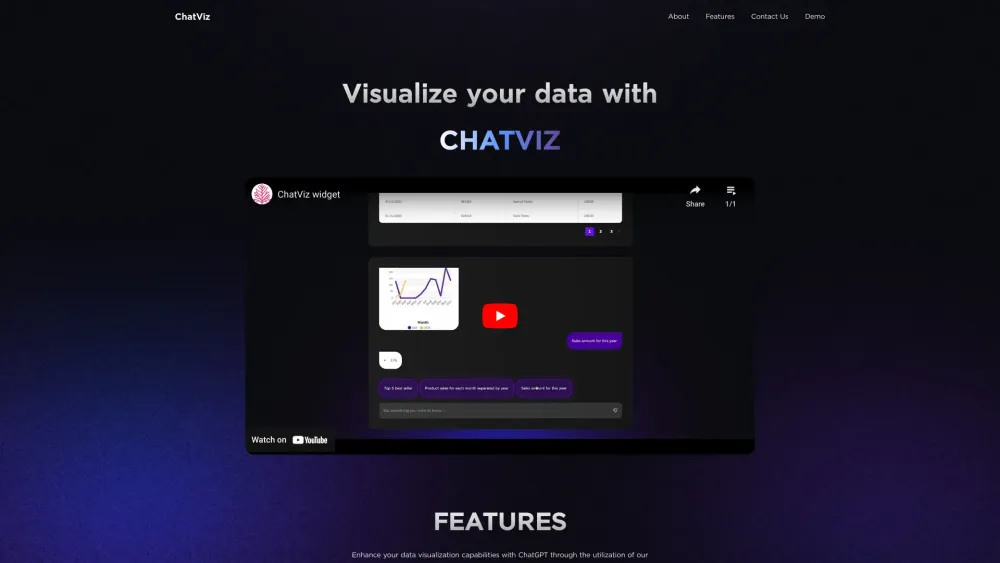
A developer tool to visualize data using ChatGPT.
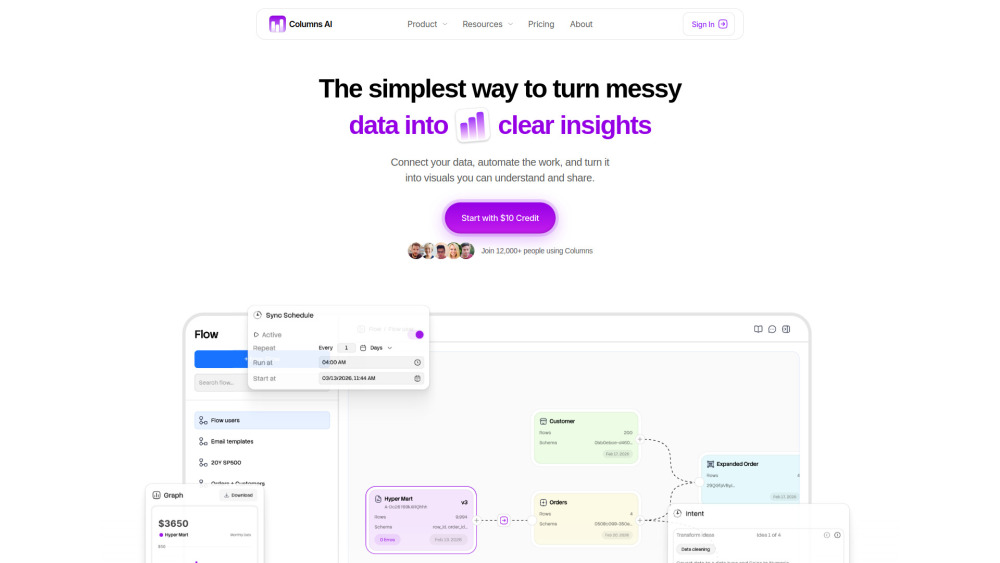
AI-powered platform for automated data cleaning, visualization, and storytelling.

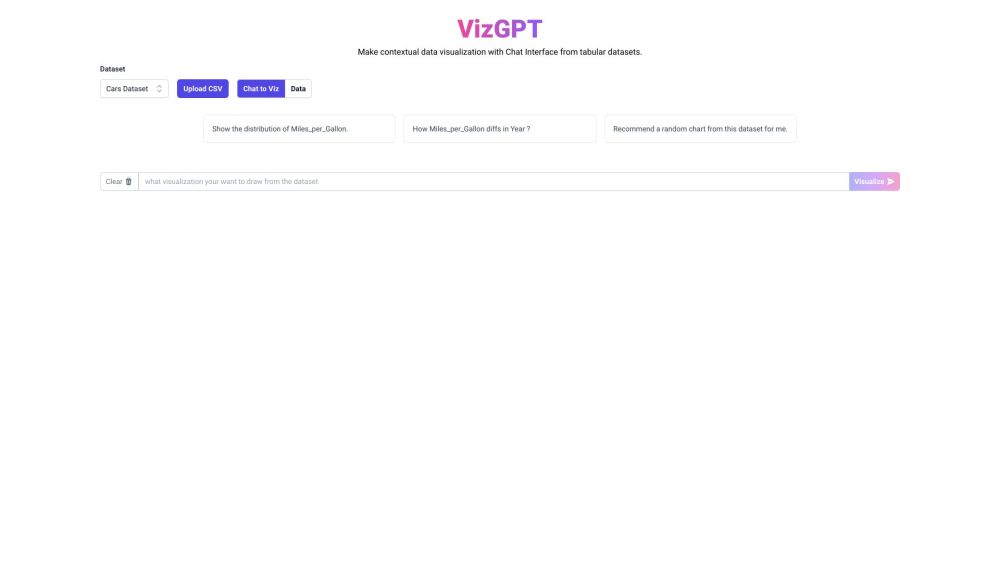
AI tool for generating visualizations from natural language queries and datasets.

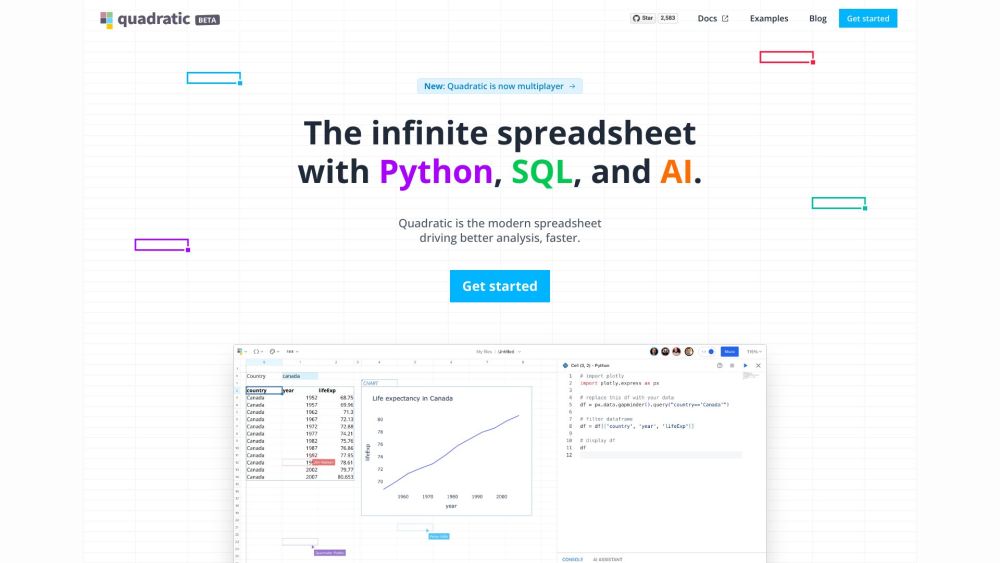
AI spreadsheet with code, connections, and real-time collaboration for data analysis.

Intelligent visualization component based on AI and algorithms.


AutoNotes is an AI-powered tool for therapists to generate progress notes, treatment plans, and clinical documentation.