Scoop Analytics





Scoop is an analytics platform that investigates your business data for you. Here's the problem it solves: Your dashboard shows sales dropped 20% last month. Now what? Normally you'd spend hours exporting data to Excel, filtering by region, checking different customer types, comparing time periods—trying to figure out what actually happened. Scoop does that investigation automatically. You ask "why did sales drop?" and it checks everything: Was it a specific region? Certain customers? Product issues? Timing? It tests these possibilities across your data and tells you what it found in plain English. The platform connects to wherever your data lives—Salesforce, your database, Excel files, Google Sheets, HubSpot—and looks across all of it at once. You don't move anything or set up complicated integrations. Beyond answering your questions, it finds things you weren't looking for. Like a group of high-value customers you didn't know existed. Or patterns that predict which customers are about to leave. Or what actually makes your best deals close. You can turn these findings into presentations for meetings (takes about 30 seconds) or automatically send predictions to your CRM so your sales team sees which leads are most likely to convert. Built for business users who need answers quickly. No SQL, no coding, no waiting for the data team to get back to you. Ask questions the way you'd ask a person, get useful answers you can act on. The platform runs on enterprise infrastructure (SOC 2 certified, handles millions of data rows) but you don't need to be technical to use it.
AI analytics tool that answers questions about your business data in plain English. Instead of manually digging through spreadsheets and reports to understand why numbers changed, ask Scoop "why did sales drop?" or "which customers are likely to leave?" and it investigates automatically. Connects to your business tools (Salesforce, databases, spreadsheets) and explains what it finds in normal language. For teams who need quick answers without technical skills.
- Customer Churn Prediction
- Revenue Forecasting
- Lead Scoring
- Customer Segmentation
- Sales Pipeline Analysis
- Marketing Attribution
- Health Score Automation
- Cross-Sell Discovery
- Executive Reporting
- Deal Intelligence
- Performance Comparison Across Locations
- Connect your data sources (Salesforce
- databases
- spreadsheets). Ask questions in plain English and get insights with visualizations showing what's happening in your data. Scoop also discovers patterns automatically—things you didn't know to ask about. Export findings to presentations or push predictions directly to your CRM.

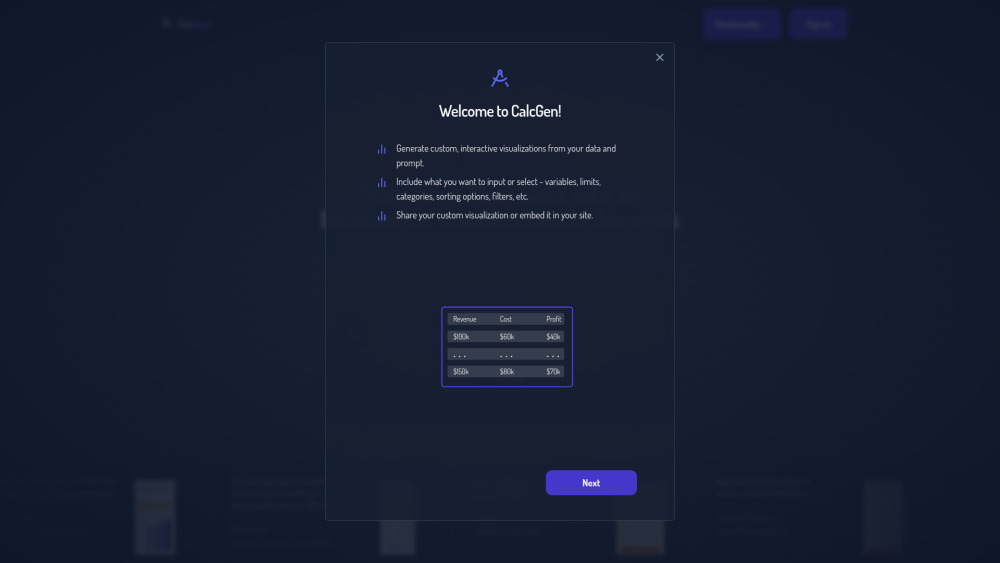
AI-powered platform for creating interactive charts, graphs, calculators, and data visualizations.

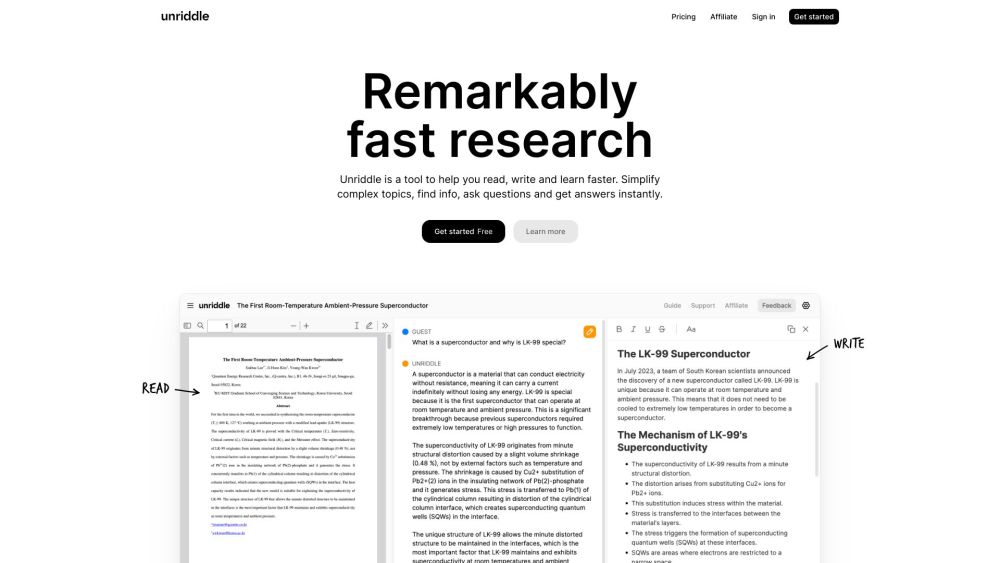
An AI research assistant to understand, organize, and write scientific documents faster.

Unlock your team's full potential with AI-powered collaborative whiteboards and knowledge cards. illumi helps you work smarter, capture ideas faster, and turn team conversations into real results.


Web-based platform for software development and version control using Git.

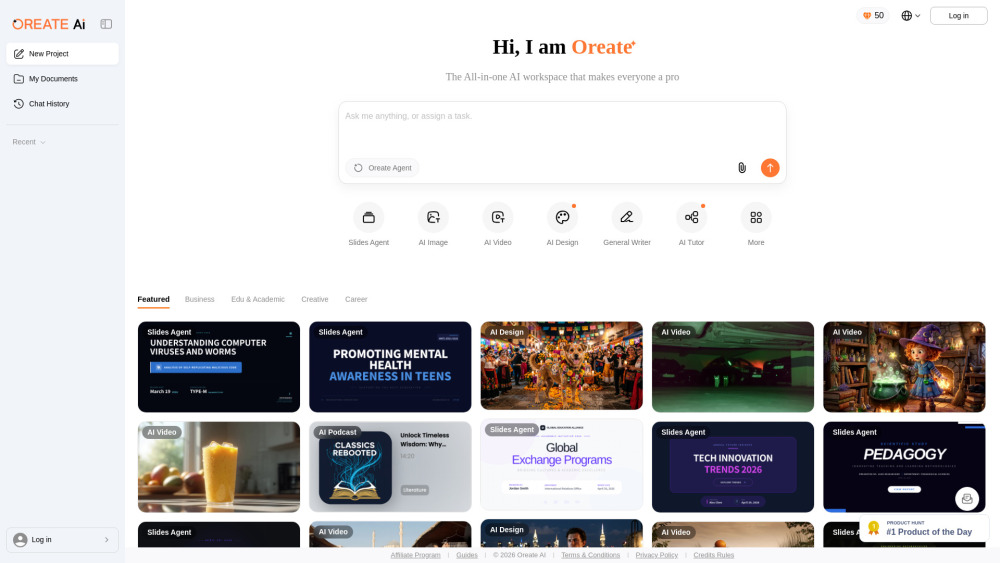
All-in-one AI Workspace: Create professional slides, essays, videos, images, podcasts, and deep research in minutes.

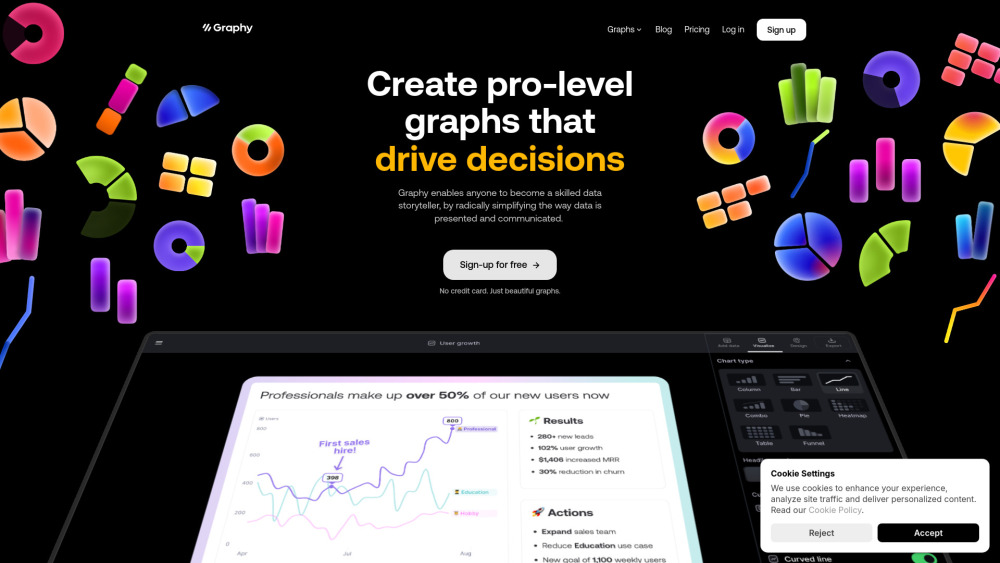
Graphy simplifies data storytelling with easy, fast, and beautiful graph creation for everyone.
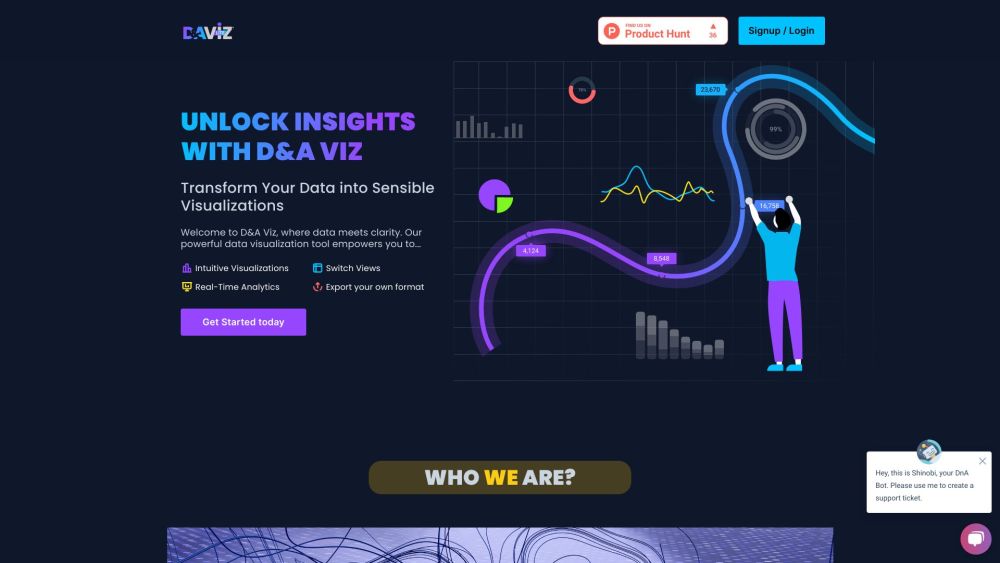
AI tool transforming raw data into visual insights for informed decisions.

STEP 1 is an AI-based Web3 user graph for reward optimization using big data.


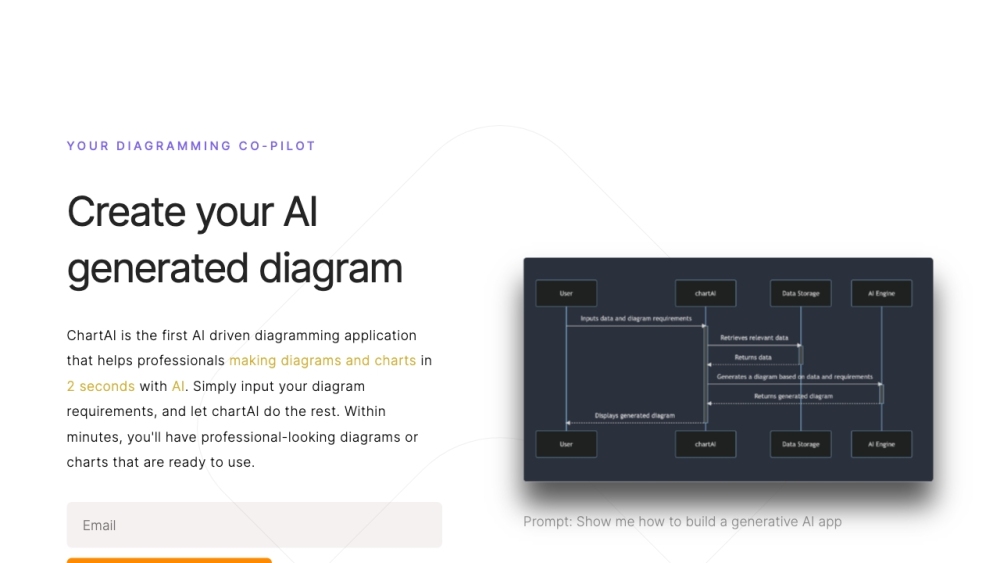
AI-powered diagram and chart creation tool that generates professional visuals in seconds.