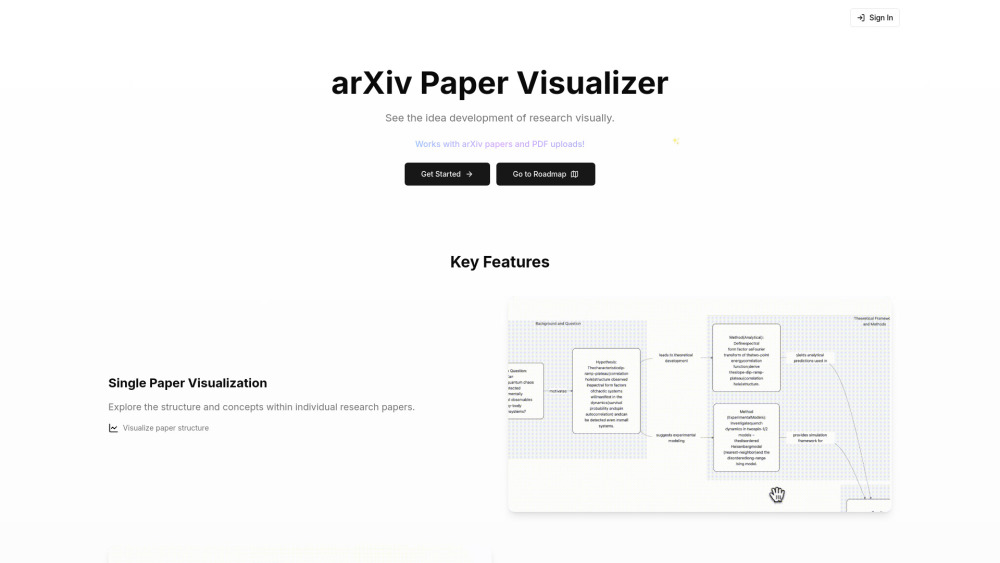
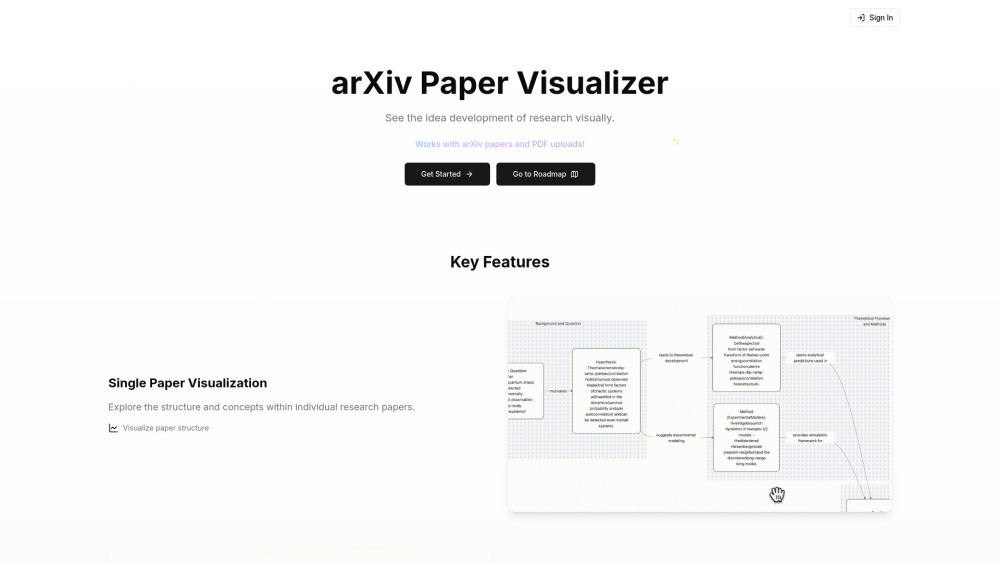




Paper Visualizer is a tool designed to help researchers understand and digest complex academic papers more efficiently. It transforms research papers into visual knowledge, allowing users to visualize steps of proof, untangle literature reviews, and explore relationships between different works. It works with arXiv URLs and PDF uploads, providing interactive visualizations to enhance comprehension and collaboration.
Transforms research papers into visual knowledge for better understanding and collaboration.
- Mapping research connections to understand relationships between papers.
- Breaking down complex methods and mathematical proofs into step-by-step diagrams.
- Getting a quick visual overview of a paper's structure and key ideas.
- Customizing visualizations with AI assistance.
- To use Paper Visualizer
- simply upload a PDF of a research paper or paste an arXiv URL. The AI will analyze the paper's content
- structure
- and relationships to create visual representations. Users can then interact with these dynamic visualizations and share them with colleagues or students.

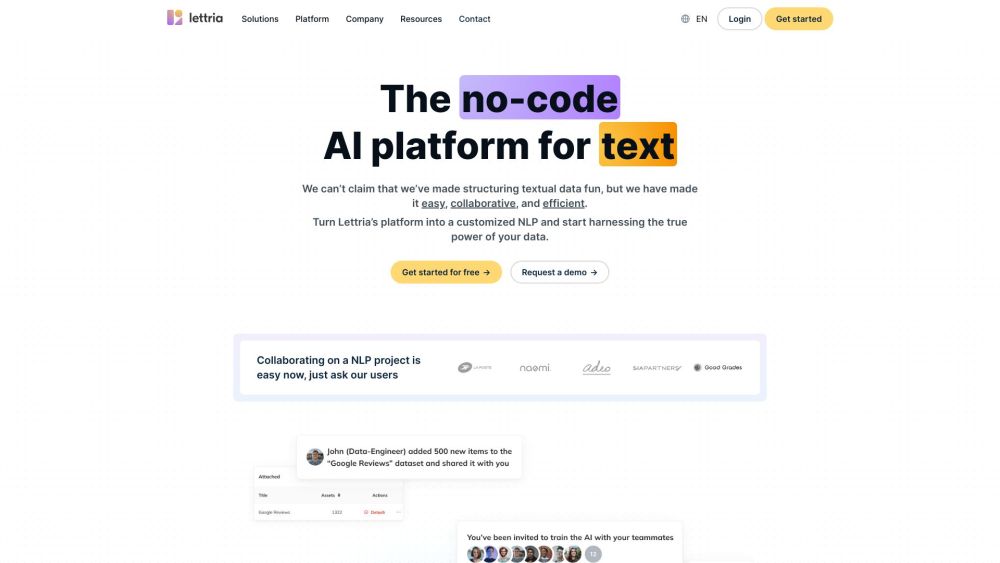
Lettria transforms unstructured data into structured knowledge using AI and GraphRAG.

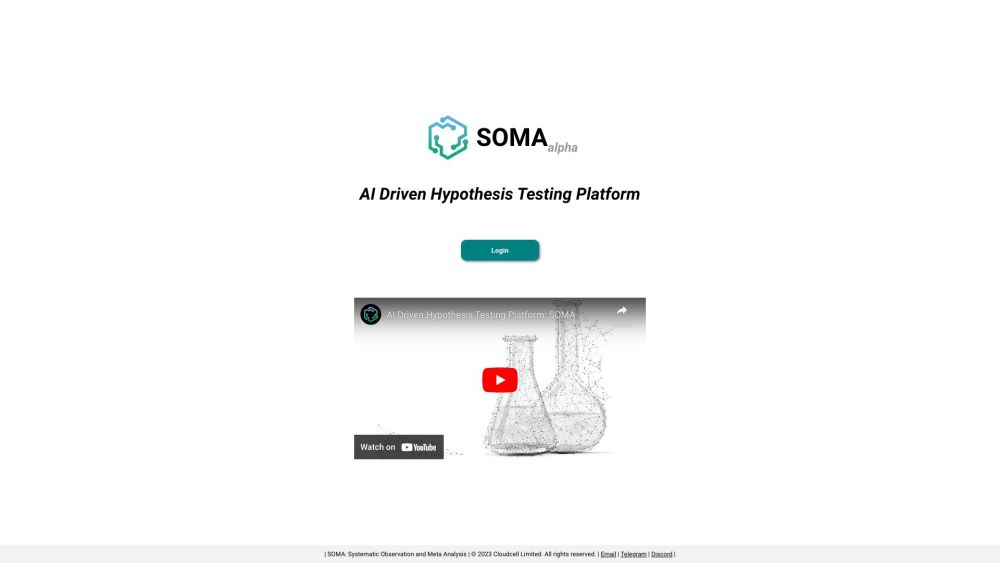
AI-powered research platform for uncovering connections between factors and medical conditions.

AI tool for summarizing, organizing, and recalling online content for enhanced memory and knowledge.
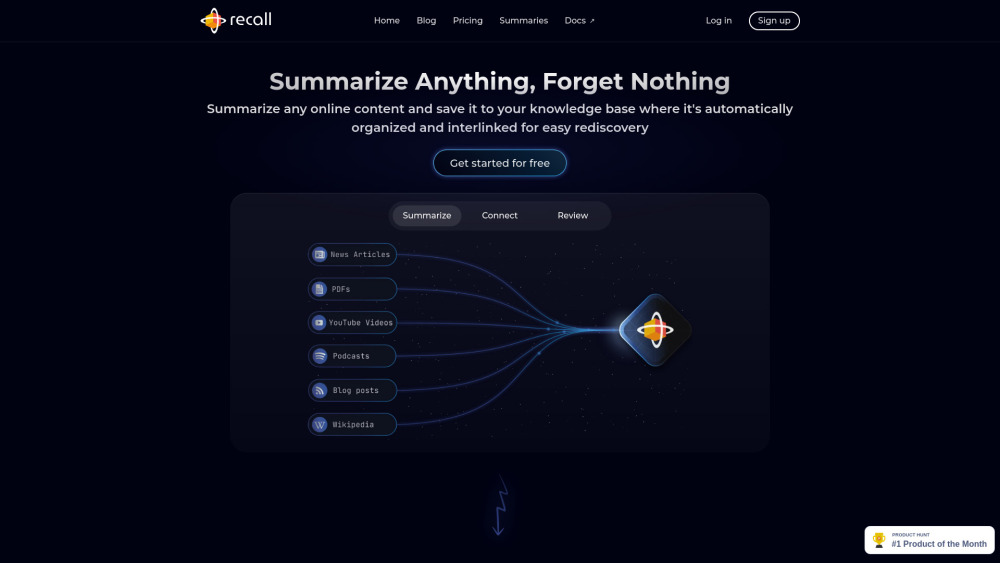

Visual search engine for scientific knowledge, promoting open science and discovery.

Graphzila creates knowledge graphs from text using OpenAI's GPT-3.5 Turbo.

AI tool enhancing webpage interaction with smart search, Q&A, graph visualization, and highlighting.

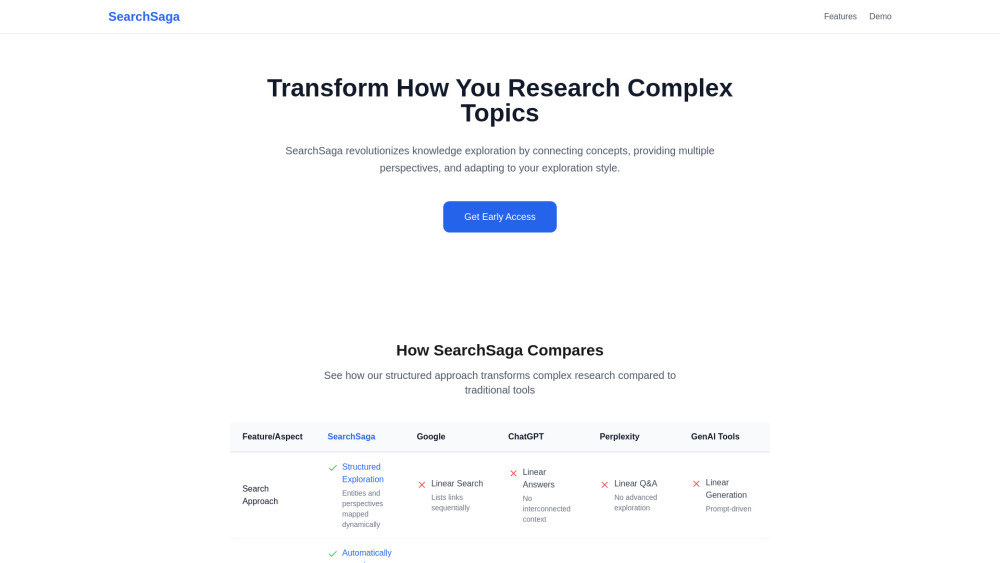
Intelligent platform for structured research insights.

AI-powered research intelligence platform for insights into the global research ecosystem.


An ontology-centered Graph RAG platform that structures documents into reusable AI knowledge packs.